3 Insightful Visualizations Infographics on Global Economic Overview 🗺️📍🌍
1 April, 2024
As data and technology continue opening windows into the world, we gain fascinating perspectives on the similarities and differences between countries. Reports leveraging well-being surveys, census figures, and economic metrics offer a meaningful look beyond basic stats.
In this article, we'll explore three compelling visualizations that showcase trends across societies. From 😊 happiness rankings and 🏙 population densities to 📉 falling inflation worldwide, each reveals telling insights into the dynamics shaping life in nations everywhere. So let's dive into these illuminating 📊 data landscapes and discover what they convey about economics, demographics, and quality of life on a global 🌎 scale.
📈 World Population Density 2023
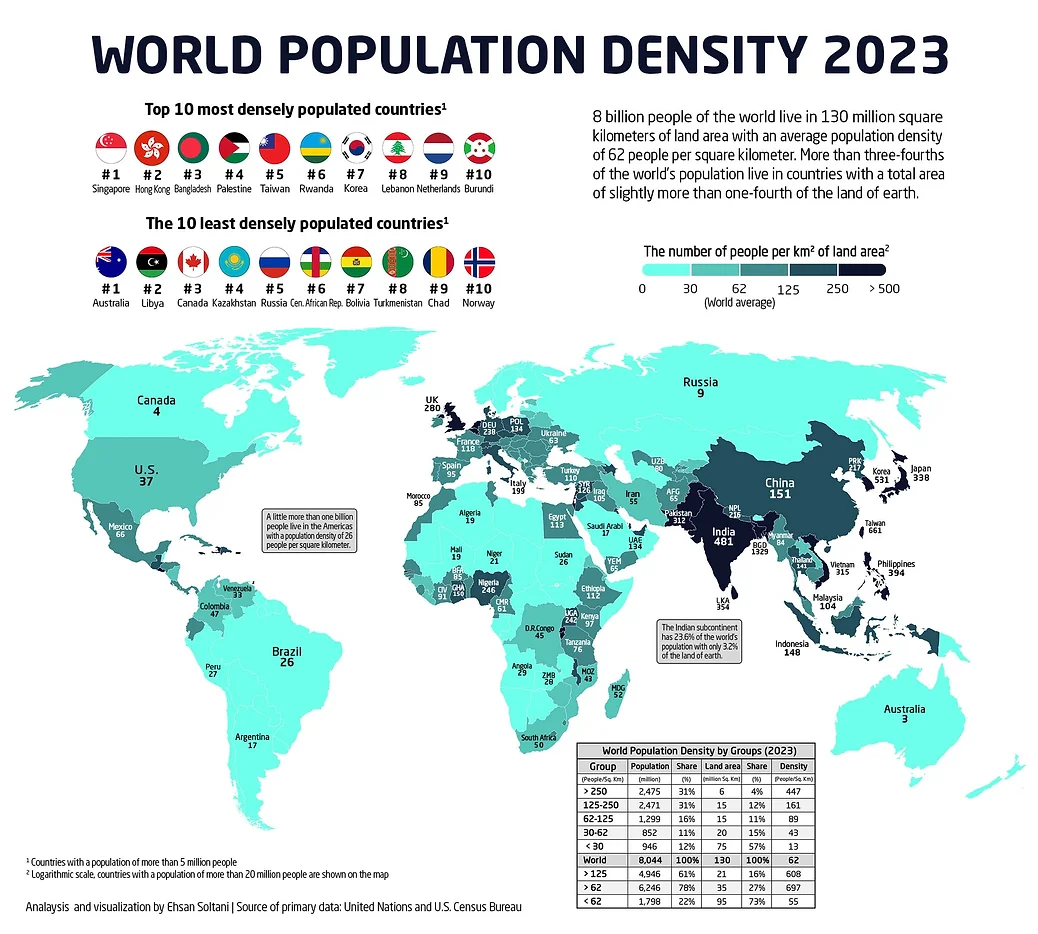
8 billion people occupy 130 million km2 of land, averaging 62 people/km2.
Distribution varies greatly by continent, region and country.
🌍 By the Numbers
- Asia has 60% of world's people with density 2.5x the average.
- Americas and Oceania have low density despite large land areas.
- Europe has 400m people at 160 people/km2 in West/South and 170m at 80 people/km2 in East.
🇮🇳 Indian Subcontinent
23.6% of world population on just 3.2% of land, averaging 460 people/km2.
India to surpass China as most populated nation at 480 people/km2.
🥇 Most Dense Countries
Singapore, Hong Kong, Bangladesh, Palestine top the list over 500 people/km2.
🥉 Least Dense Countries
Australia, Libya, Canada, Kazakhstan, Russia have lowest densities under 2 people/km2.
In summary, population densities vary greatly worldwide based on available land and regional differences. Asia remains the most dense continent overall.
🧑🤝🧑 Measuring Global Happiness
The World Happiness Report ranks countries based on life evaluations from the Gallup World Poll.
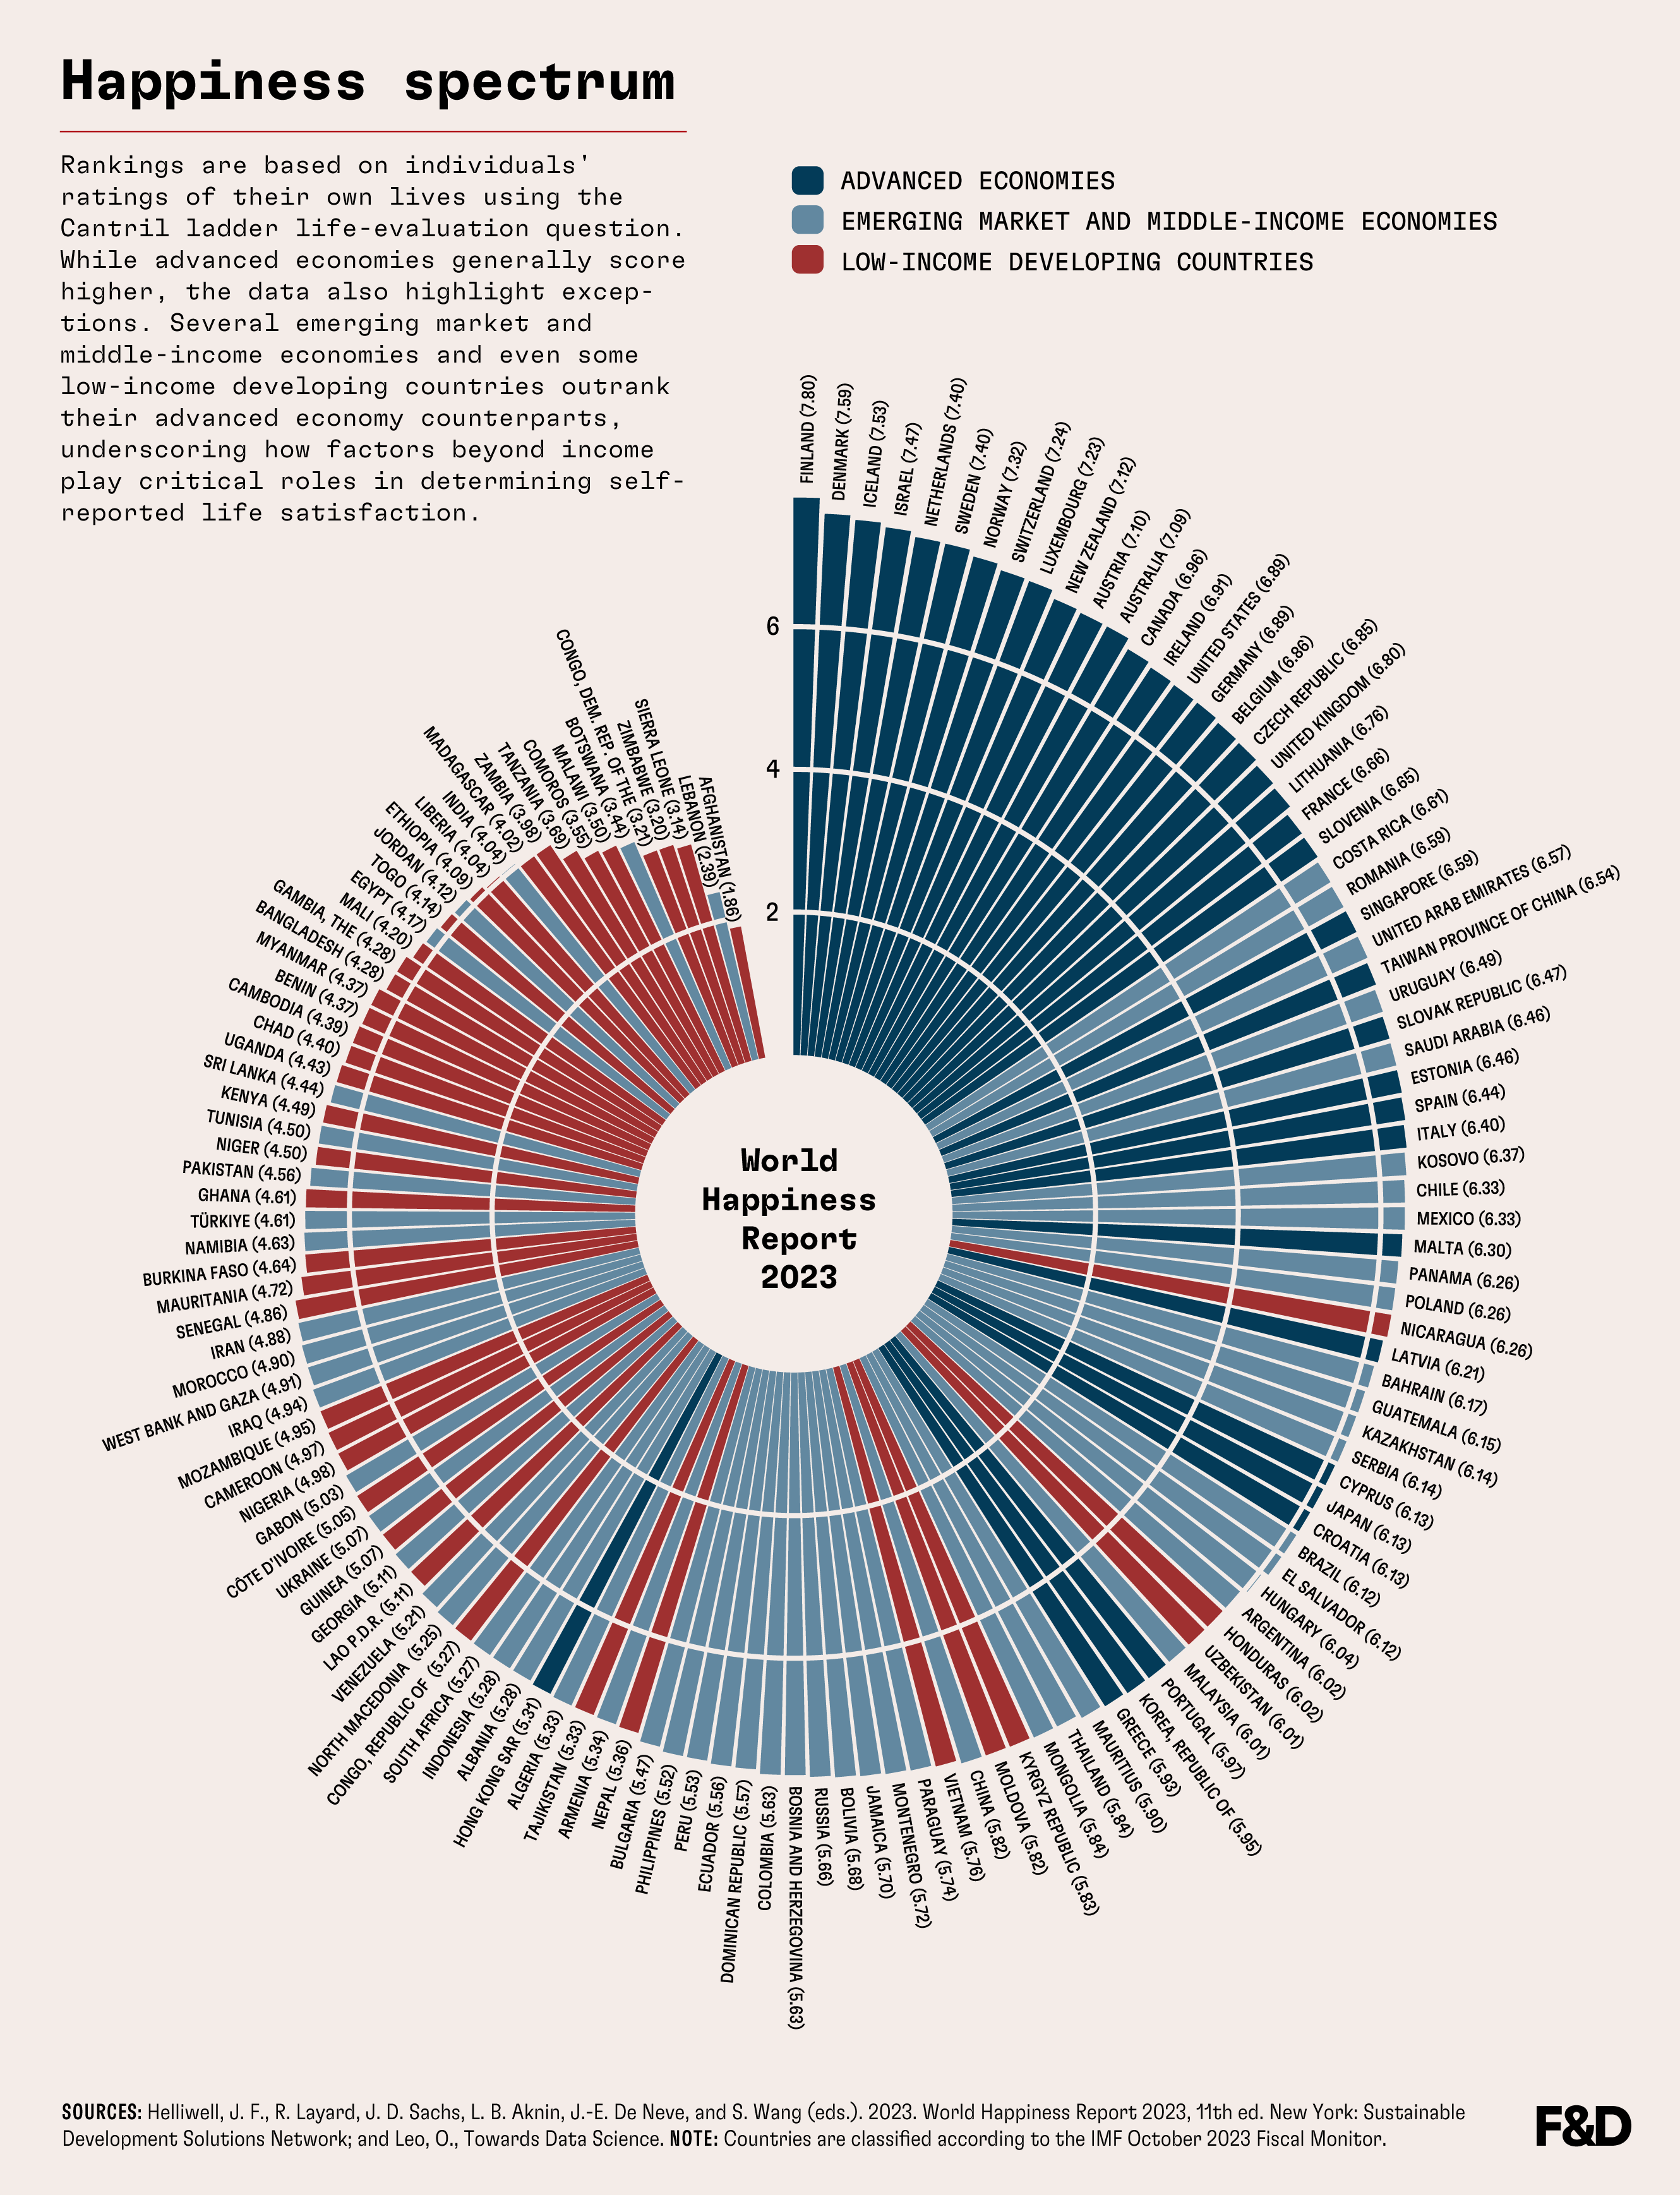
Finland, Denmark, Iceland top the 2024 rankings based on averages from 2021-2023.
🥇 Top 10 Happiest Countries
- 🇫🇮 Finland
- 🇩🇰 Denmark
- 🇮🇸 Iceland
- 🇸🇪 Sweden
- 🇮🇱 Israel
Small, wealthy European nations dominate the top. Costa Rica and Kuwait are new to the top 20.
Population size correlates with rank - only Netherlands and Australia in top 10 have over 15M people.
💔 Least Happy Countries
Afghanistan ranks last with a score of 1.7, only Asian nation in bottom 10.
U.S. and Canada see a happiness gap between old and young not seen in Nordic countries.
Central/Eastern Europe converging with Western Europe in happiness after decades of a gap.
The report provides useful insights into factors that affect national well-being and life satisfaction.
🔥 How Far Have Inflation Rates Fallen Across the G20?
After high inflation during the pandemic, central banks aim for 2-3% rates. Let's look at where G20 countries stand now.
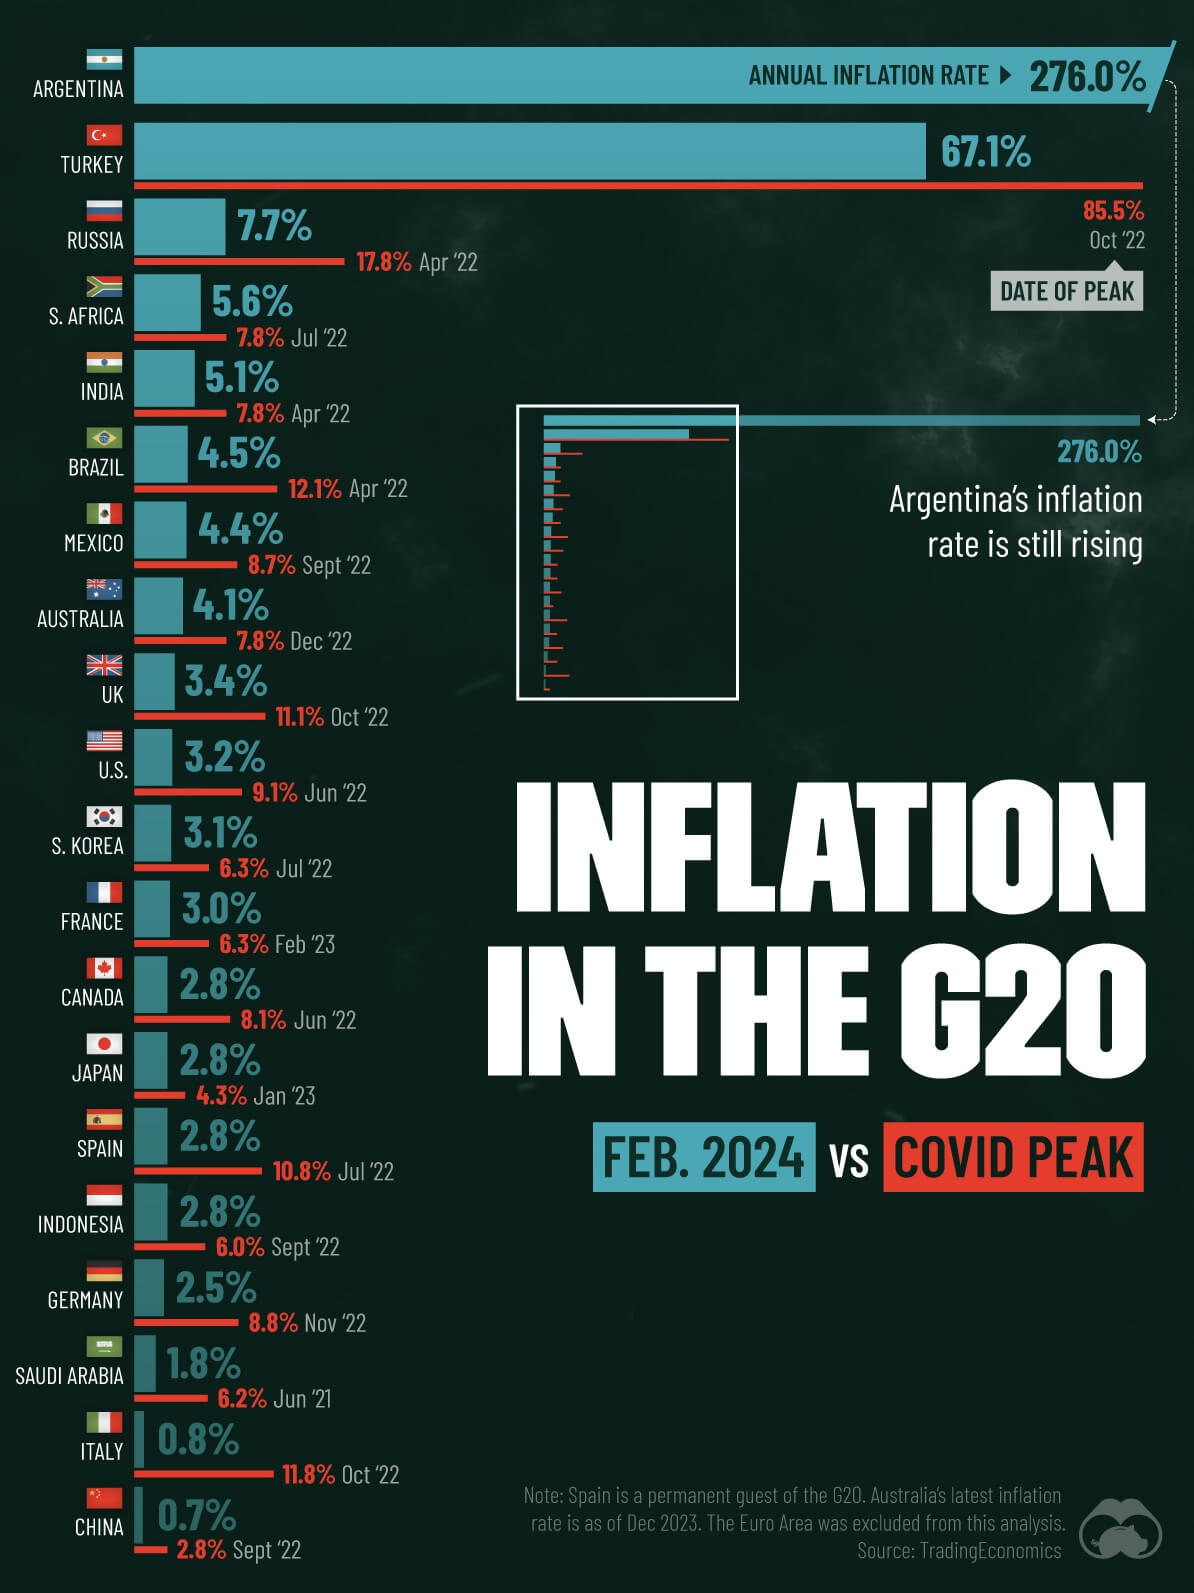
This data from Trading Economics shows annual inflation rates in February 2024 vs each country's COVID peak.
🏆 Inflation Rates Now vs Peak
- 🇦🇷 Argentina - 276% now (peak N/A)
- 🇹🇷 Turkey - 67.1% now, 85.5% Oct 2022 peak
- 🇷🇺 Russia - 7.7% now, 17.8% Apr 2022 peak
- 🇿🇦 South Africa - 5.6% now, 7.8% Jul 2022 peak
and rates for other G20 nations
💸 One Standout:
Argentina's inflation has only increased since the pandemic. This is due to long history of printing money to cover government overspending.
Food prices have been hit hard in Argentina too - like beef prices up 40-70% from Jul-Aug 2023.
🔎 Most G20 nations have curbed inflation from pandemic peaks, but Argentina still faces sky-high rising costs. Central banks aim to get all rates closer to 2-3% target.