
Bayesian Statistics In Financial Markets and Trading
31 December, 2023
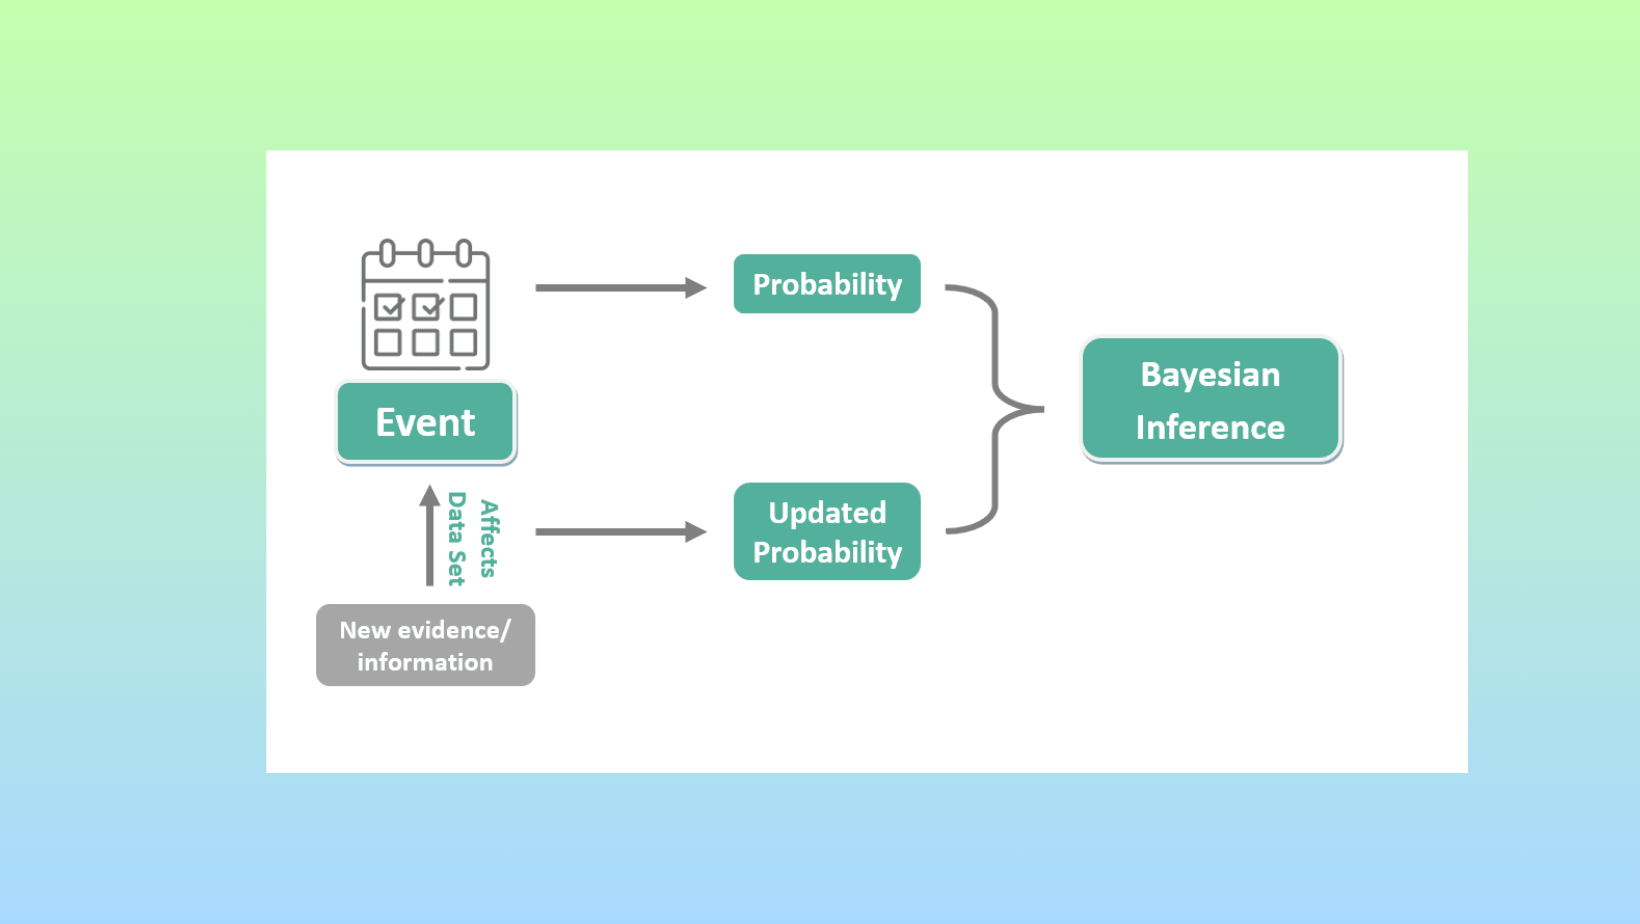
Bayesian statistics provides a logical way to analyze probabilities using real-world data. At its core, it allows experts to quantify their beliefs about possible outcomes as prior probabilities. It equips analysts with a mathematical process for rationally adjusting what they believe about potential outcomes as new information becomes available. These experts can then update those probabilities when presented with new evidence or measurements.
For example, say a trader has a hypothesis about market trends. Based on experience, they assign a 40% chance the trend will continue. After more price action, their belief either strengthens or weakens. Bayesian analysis gives a calculated way to revise that initial probability based on what the new data shows. This iterative process captures how knowledge grows over time as more facts emerge.
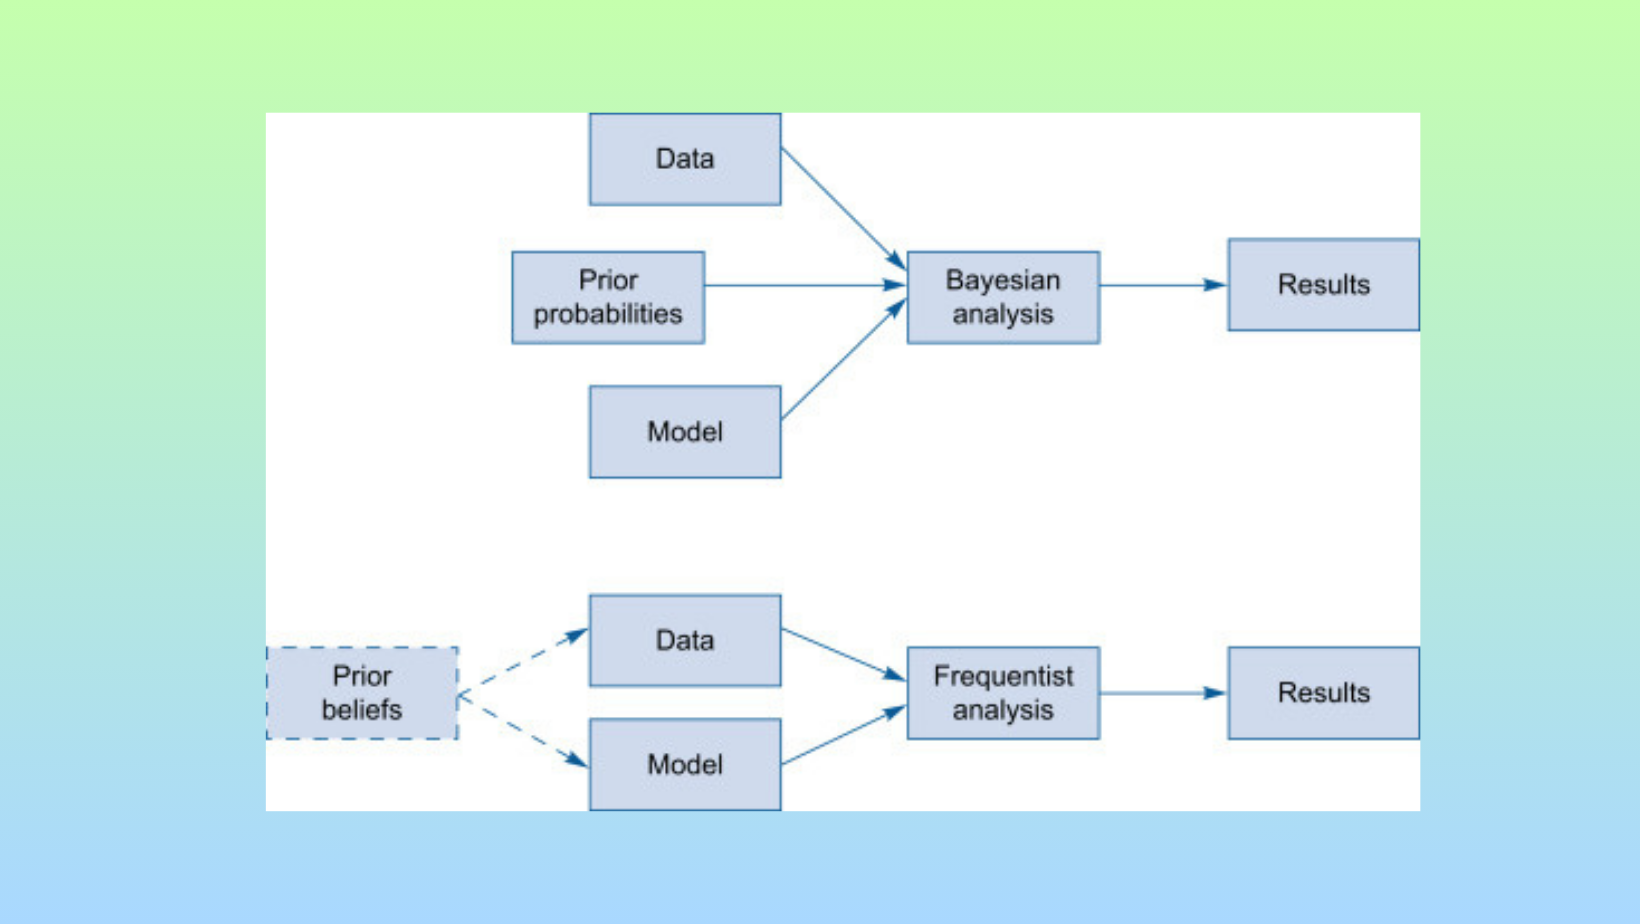
Perhaps most useful is how Bayesian thinking frames probabilities. Rather than objective long-term frequencies, it views them as subjective degrees of belief. These probabilities change as understanding improves. Bayes' theorem supplies the exact formula needed to rationally shift probabilities between a prior and posterior based on new informative evidence. Applied across many decisions, this helps traders make more accurate assessments under uncertainty.
Applications
Bayesian probability is applied in businesses based on confidence levels rather than just past occurrence rates. However, the model can still account for experience.
Managers bring their perceptions into the calculations. But the analysis also looks at hard data patterns over time. For finance examples, numbers from the history often provide insights. Using the measurable facts as the starting point can yield useful predictions while keeping openness to expert views.
This objective-yet-flexible viewpoint comes from a school of Bayesian thought. It focuses more on frequencies in records than individual views alone. For market modeling work, relying partly on what concretely happened previously aids the effort. This approach remains informative while allowing room for specialist perspective too.
Example of Bayesian Probability in Action
Let's consider how a change in interest rates might impact the stock market. We can look back at similar past situations to start forming an idea.
Historical records give us plenty of data points showing what happened to a stock index when interest rates moved. In our example, out of 2,000 observations of rates changing, the index fell 1,150 times.
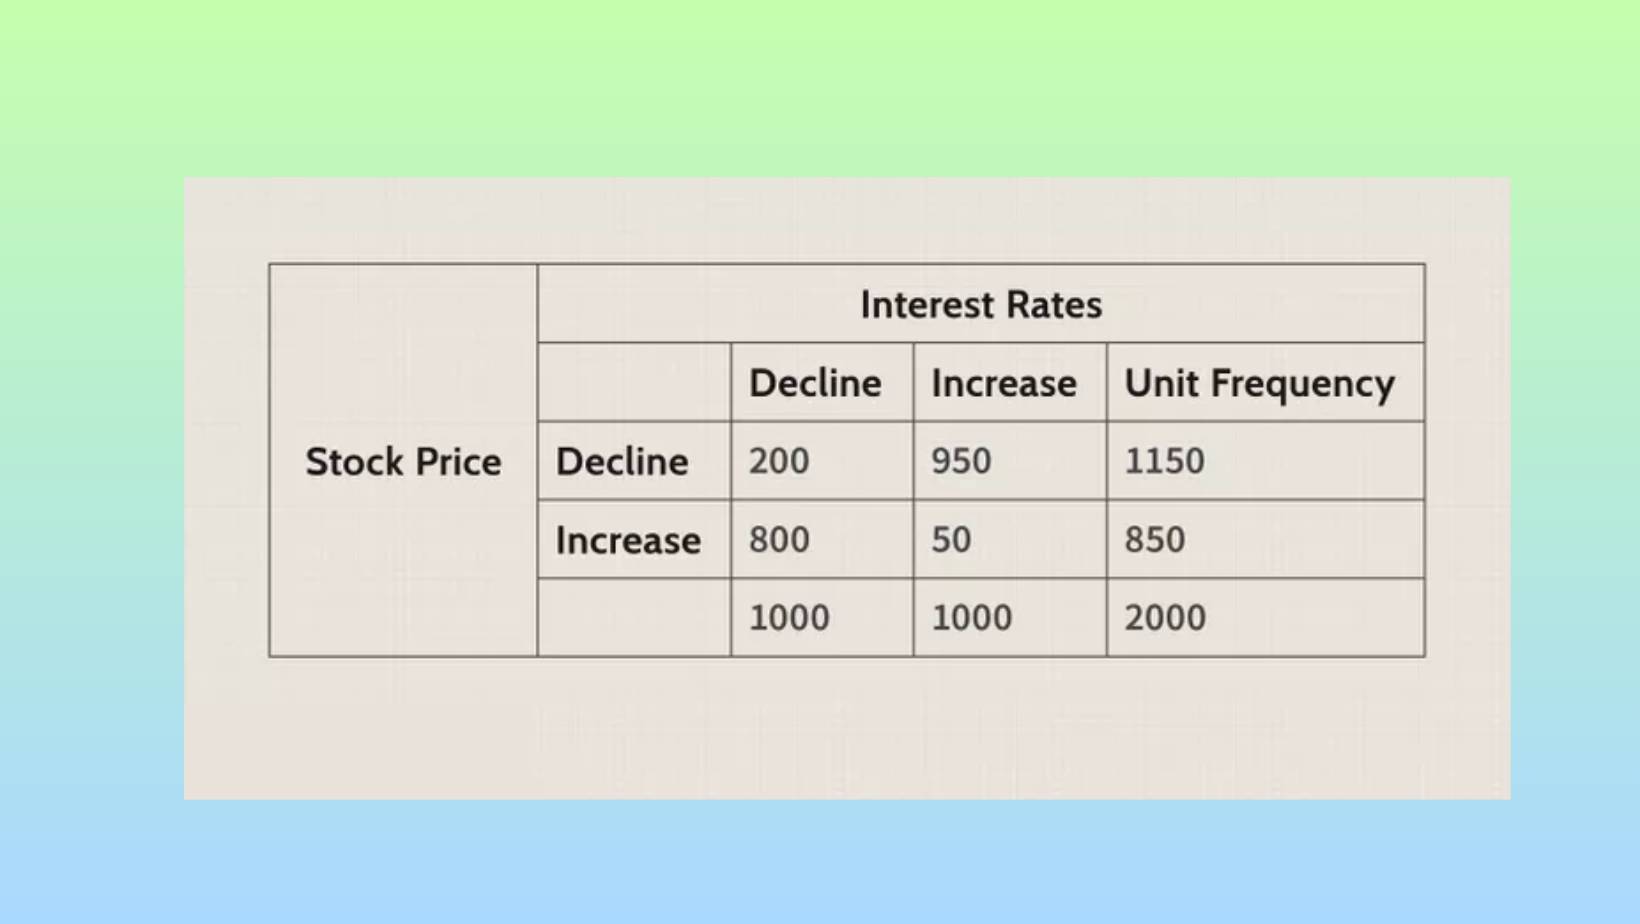
So initially, there's a 57.5% chance (1,150/2,000) the index would decline based solely on past patterns. This is our beginning probability without considering the current rate situation.
But now we know rates specifically increased this time. Factoring that new piece of information, our probability estimate updates. Taking the past performance into account along with the added context changes our view.
After revising our analysis with the interest rate increase, the odds shift to 95% the index will decrease. The probability moves upwards significantly once we learn the key detail about rates rising presently.
This demonstrates how Bayesian thinking improves predictions by continuously refining beliefs with each new relevant data point that comes to light.
Bayesian Price Direction Prediction
Predicting which way market prices will move is a key task for any trader. Traditional statistical approaches analyze historical price data using techniques like linear regression to identify long-term trends or support and resistance levels.
However, financial markets are inherently uncertain and probabilistic in nature. Bayesian statistics provides a powerful framework for quantifying this uncertainty and estimating the likelihood of different future price outcomes.
Markov Chains for Sequential Price Movements
One Bayesian approach is to use a Markov chain model. A Markov chain represents a sequence of random variables where the probability of future states depends only on the present state, not past states.
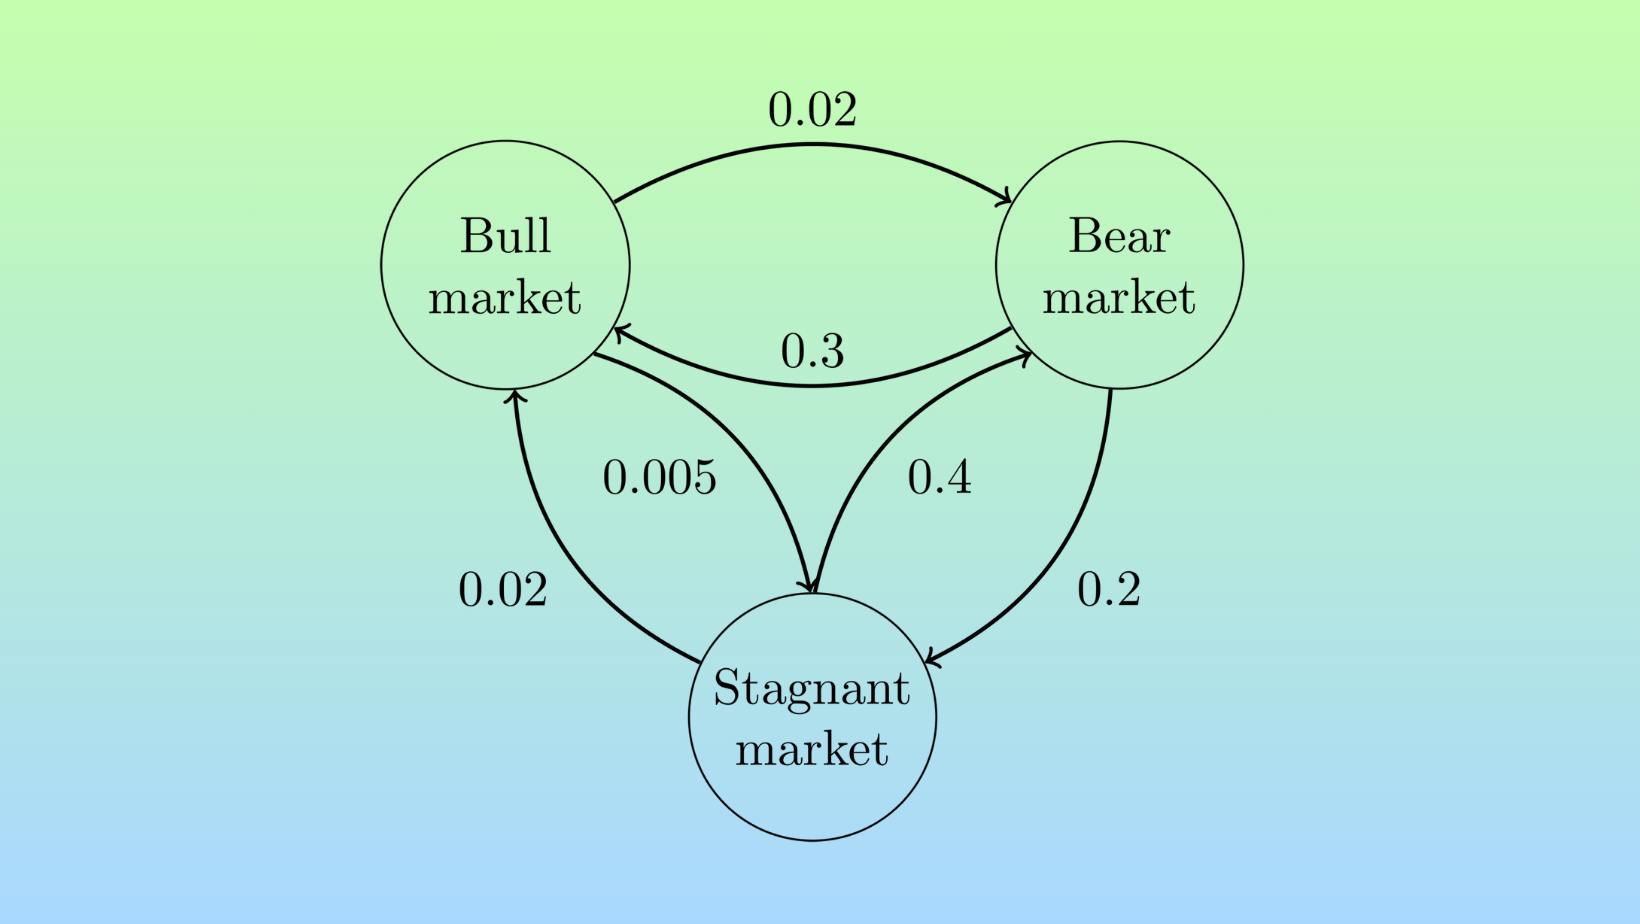
When applied to financial price data, it can capture the tendency of prices to persist in a given direction for a number of periods before reverting.
For example, a simple two-state Markov chain could label prices as either "up" or "down" based on daily returns. It would estimate the probability of remaining in the current state or transitioning to the opposite state. This provides a forecast of the likelihood of an ongoing upward or downward trend over the next trading period. More complex Markov chains with additional states can model variations in volatility or distinguish between small and large price changes.
Bayesian Networks for Multivariate Prediction
Bayesian networks go a step further by allowing for multivariate prediction based on multiple interrelated risk factors. These directed graphs represent conditional dependencies between variables and quantify how the probability of some variables being in specific states is impacted by the states of other "parent" nodes.
For instance, a Bayesian network could represent linkages between an asset's price, its sector index, macroeconomic indicators like interest rates, and soft variables like analyst sentiment ratings. It would learn the joint probabilistic structure from historical observations. This more holistic perspective allows generating richer probabilistic outlooks accounting for intermarket linkages and factor interactions influencing near-term price behavior.
Bayesian Trading Patterns and Signals
A Bayesian approach to trading involves assessing market conditions and signals as conditional probabilities that continuously update based on new price action. Here are some examples:
Mean Reversion
An overextended move creates a 70% chance that prices will revert strongly towards the daily average within the next few periods. A bullish engulfing candlestick appearing as prices reach two standard deviations from normal levels boosts this probability to 90%, triggering a mean-reversion trade.
Rangebound Behavior
Prices consolidating within a $1 range over the past week suggests a 65% likelihood of continued sideways action. But volatility contracting on higher volume gives a preliminary signal this pattern may transform. If a breakout ensues, the trader adjusts to an 85% probability of the breached range acting as new support/resistance.
News Events
Pending major economic data presents a baseline 30% risk of an outsized market reaction. But prices becoming unusually quiet or option markets pricing in an increase in implied volatility raises this probability to 50%, affecting position sizing. Unexpected news headlines shooting volatility higher confirms the 70% outlook.
By conditioning probabilities on incoming information, Bayesian signals dynamically account for new evidence that can update baseline assumptions and trigger optimal trade entries and exits. This probabilistic process mimics how informed traders logically assess uncertain markets.
Inferring Limit Prices from Order Flow Data
To determine the best entry price, a Bayesian model can analyze patterns in past limit order book data and trading activity. For example, it may find that order volumes spike just before large price moves. By conditioning on the current order book state and volatility metrics, it can infer the probability distribution of limit prices that will likely be filled versus triggering an adverse price reaction.
Forecasting Near-Term Liquidity
Accounting for the timing of order placement is also important. Liquidity tends to ebb and flow throughout the day as different trader cohorts are actively placing orders. A Bayesian time series model viewing order metrics over time can provide a probabilistic view of expected near-term liquidity. This helps pinpoint periods when orders are most likely to be passively filled versus disrupt the market equilibrium.
Optimizing Position Size Risk/Reward
Similarly, a Bayesian model considering daily/intraday volatility and previous order sizes can generate the risk/reward probability distribution associated with different position amounts. This quantifies the tradeoff between aiming for full fills versus minimizing market impact. The optimal size maximizes expected filling rate while controlling downside risks from unfavorable slips.
By carefully estimating key uncertainties, these techniques extract the maximal information from historical datasets. The probabilistic order parameters they derive give traders an edge in stealthily executing positions at low cost.
Probabilistic Edge in Trading Different Market Conditions
In any probabilistic endeavor like trading, success stems from constantly adapting to new information and playing the highest odds opportunities.
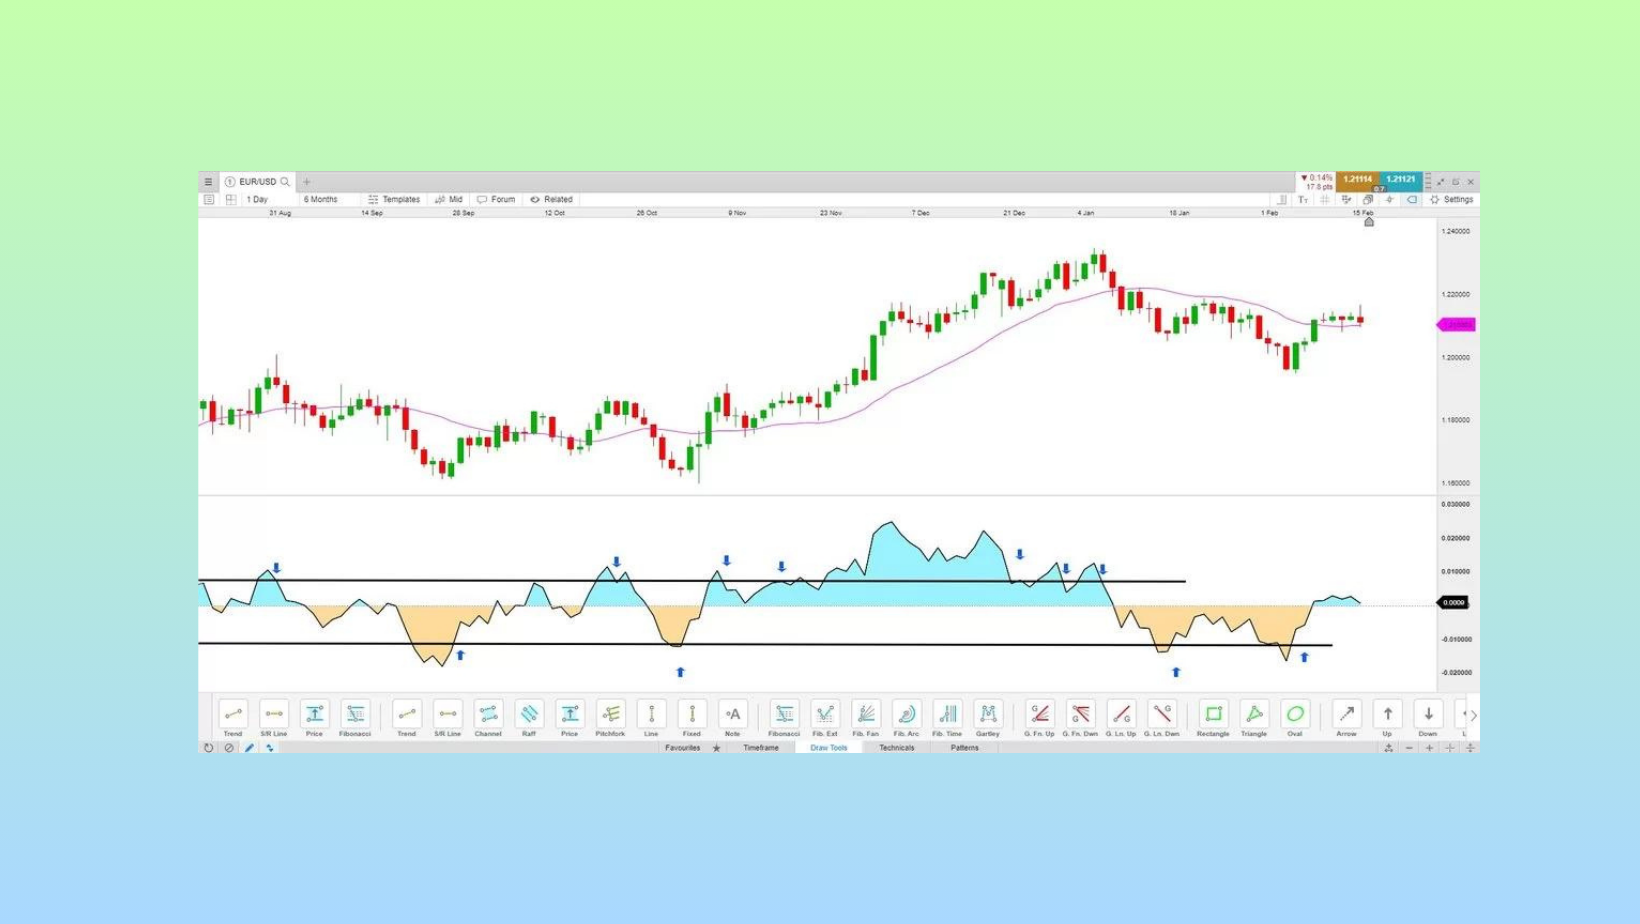
A Bayesian approach embraces this by treating market signals as live conditional probabilities rather than static triggers. As each new candlestick, bar, or tick updates the picture, the trader's edge lies in recalibrating their assumptions and following where the preponderance of evidence now points.
A profitable trading system with this mindset finds the optimal balance, going with the overall market flow rather than fighting it while losses are strictly controlled. Every trade setup enjoyed favorable odds upon entry, with position sizing scaled appropriately. By respecting the evolving story price action narrates through the lens of probabilities, traders give themselves the best shot at profitability over countless repetitive small edge situations.
Bayesian analysis allows us to leverage the probabilities of various market factors to gain valuable insights. By estimating conditional probabilities relating to elements like price movement, volatility, news, and sentiment, among others, we can determine the likelihoods of different potential outcomes.
Bayes' Theorem provides a mathematical framework to update our assessments based on new information received. As these probability estimates change with additional data, they shed light on the key drivers and most important scenarios to consider from an investment standpoint. Once we have deduced the probabilistic forecasts for metrics of interest, it is straightforward to quantify financial expectations using statistical techniques. In this way, Bayesian modeling distills a complex system with many interdependent variables into a clear probabilistic lens through which opportunities and risks can be evaluated.
These Bayesian methods have proven effective when applied judiciously in other domains, and their use in financial modeling may similarly provide helpful perspective - so long as the appropriate caveats and limitations are understood.