
Leveraging Machine Learning for an Edge in Trading: A Comprehensive Guide to Current Approaches and Factors Driving Alpha
1 December, 2023
In recent years, quantitative investing has grown tremendously in popularity among investors and professionals due to advancements in financial markets and artificial intelligence. As financial theories and AI technologies rapidly develop, quantitative strategies have increasingly captured people's attention. Compared to traditional investing, quantitative investing offers key benefits of objectivity and precision.
The rise of big data and AI has created new potential for stock selection models in quantitative investing. Bold numbers of scholars are now leveraging machine learning algorithms for modeling to effectively overcome limitations of conventional statistical models. Traditional models struggle to describe complex nonlinear relationships between stock returns and factors. They also fail to handle high-dimensional problems. By applying AI, quantitative investors can gain valuable insights from massive datasets to inform investment decisions.
What is AI Trading?
When discussing AI and the stock market, terms like algorithmic trading and automated trading often come to mind for experienced investors. While related, there are distinctions between these approaches. Quantitative trading and high-frequency trading are also commonly referenced, so let's clarify the key differences.
If your strategy involves advanced mathematical modeling and statistics without subjective qualitative judgments, it's quantitative trading. Quantitative trading relies on advanced math and statistical analysis without considering qualitative factors like a company's brand or management. Positions are opened manually.
Algorithmic trading (algo-trading) employs technical analysis and preset rule-based algorithms to divide large orders into smaller parts for execution. Algorithmic trading uses automated algorithms and rules to break up large trades, allowing computers to rapidly compare quotes and trade. Both quantitative and algorithmic approaches leverage computing power for an objective edge, though algorithmic systems take automation a step further through fully automated execution.
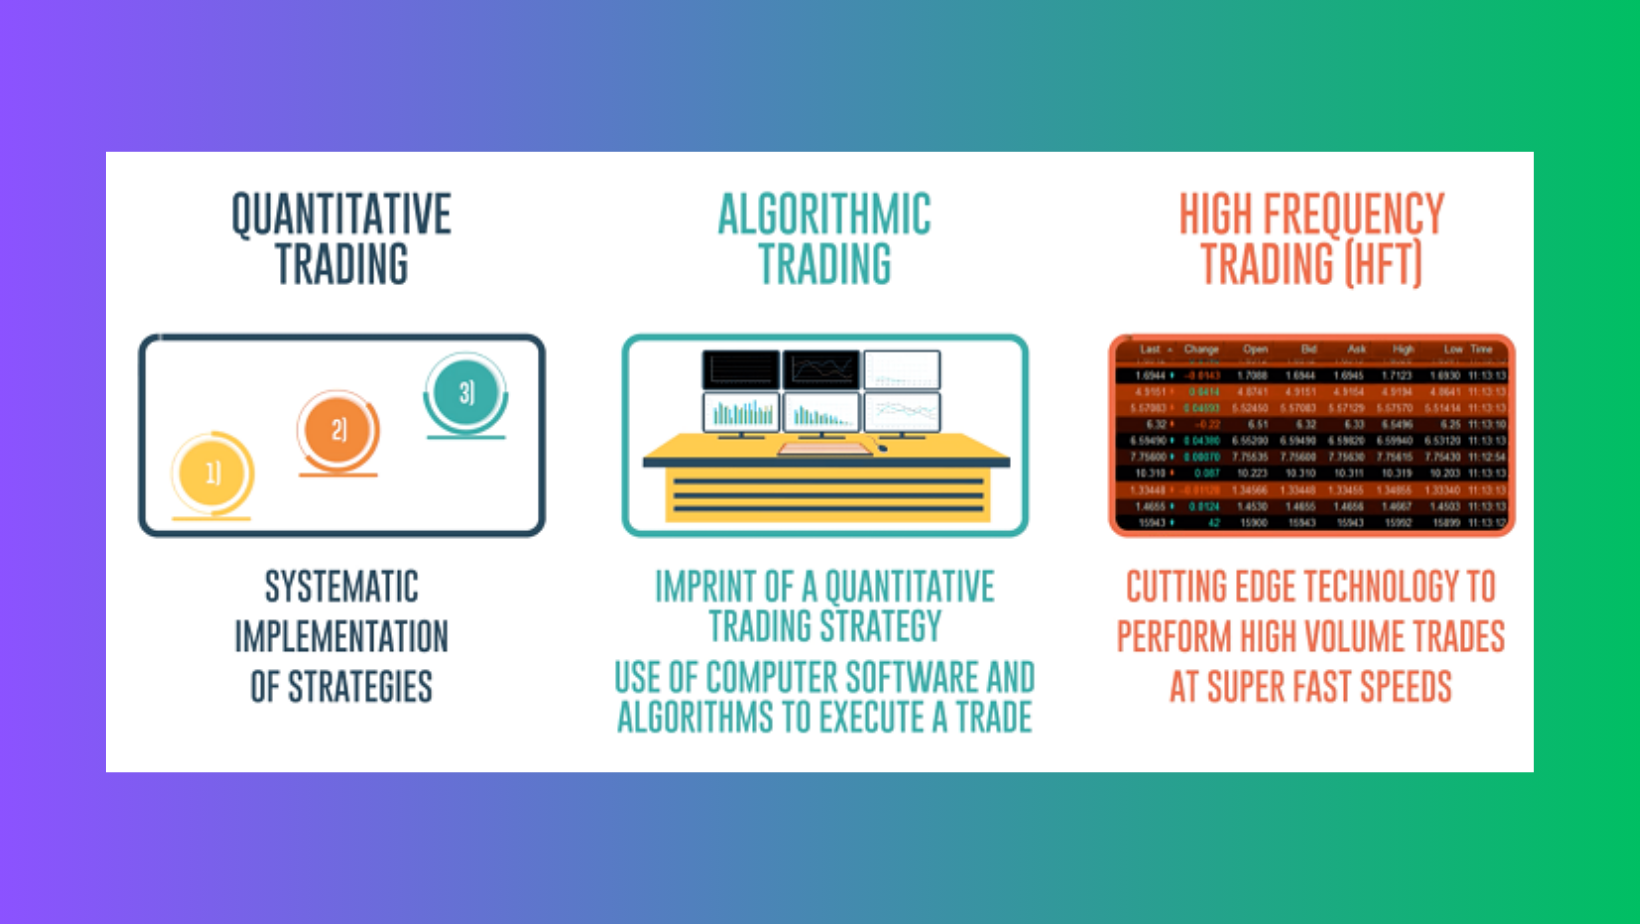
High-frequency trading (HFT) and Automated Trading
High-frequency trading (HFT) is a type of algorithmic trading known for ultra-fast trades driven by sophisticated algorithms. Leveraging high speeds and turnover, large firms can execute trades at lightning speed using HFT.
If you fully automate a quantitative strategy using computational algorithms and portfolio management systems based on past market data, you've achieved automated trading (AI trading). In this hands-off approach, a computer—not a person—buys and sells assets according to preset parameters thanks to artificial intelligence (AI) and machine learning.
While these models unlock clear benefits, don't neglect training to maximize profits. AI trading allows the most efficient market participation. However, basic fundamental analysis is critical to selecting the most promising stocks and boosting returns. Each approach offers value, but training remains important to informed decision making.
AI Trading Process
The machine learning pipeline for implementing artificial intelligence in stock market trading involves collecting different types of historical market data, preprocessing and analyzing this data using various machine learning algorithms and models, evaluating model performance, and assessing portfolio outcomes.
Historical time series, text, tick and image data are gathered on variables like stock prices, news articles, daily trading volumes and candlestick charts. This data undergoes feature engineering and is then used to train regression, classification and clustering models to predict stock price movements and market trends.
Traditional statistical methods like ARIMA are compared with sophisticated machine learning techniques such as support vector machines, boosting models and deep learning neural networks.
Model performance on test data is evaluated based on metrics like accuracy, precision, recall, MSE, RMSE and ROC curves to select the best predicting model.
Finally, the model outputs are used to simulate automated trading strategies on historical portfolio data to assess financial metrics like accumulated returns, maximum drawdowns, risk-adjusted returns and profitability over time.
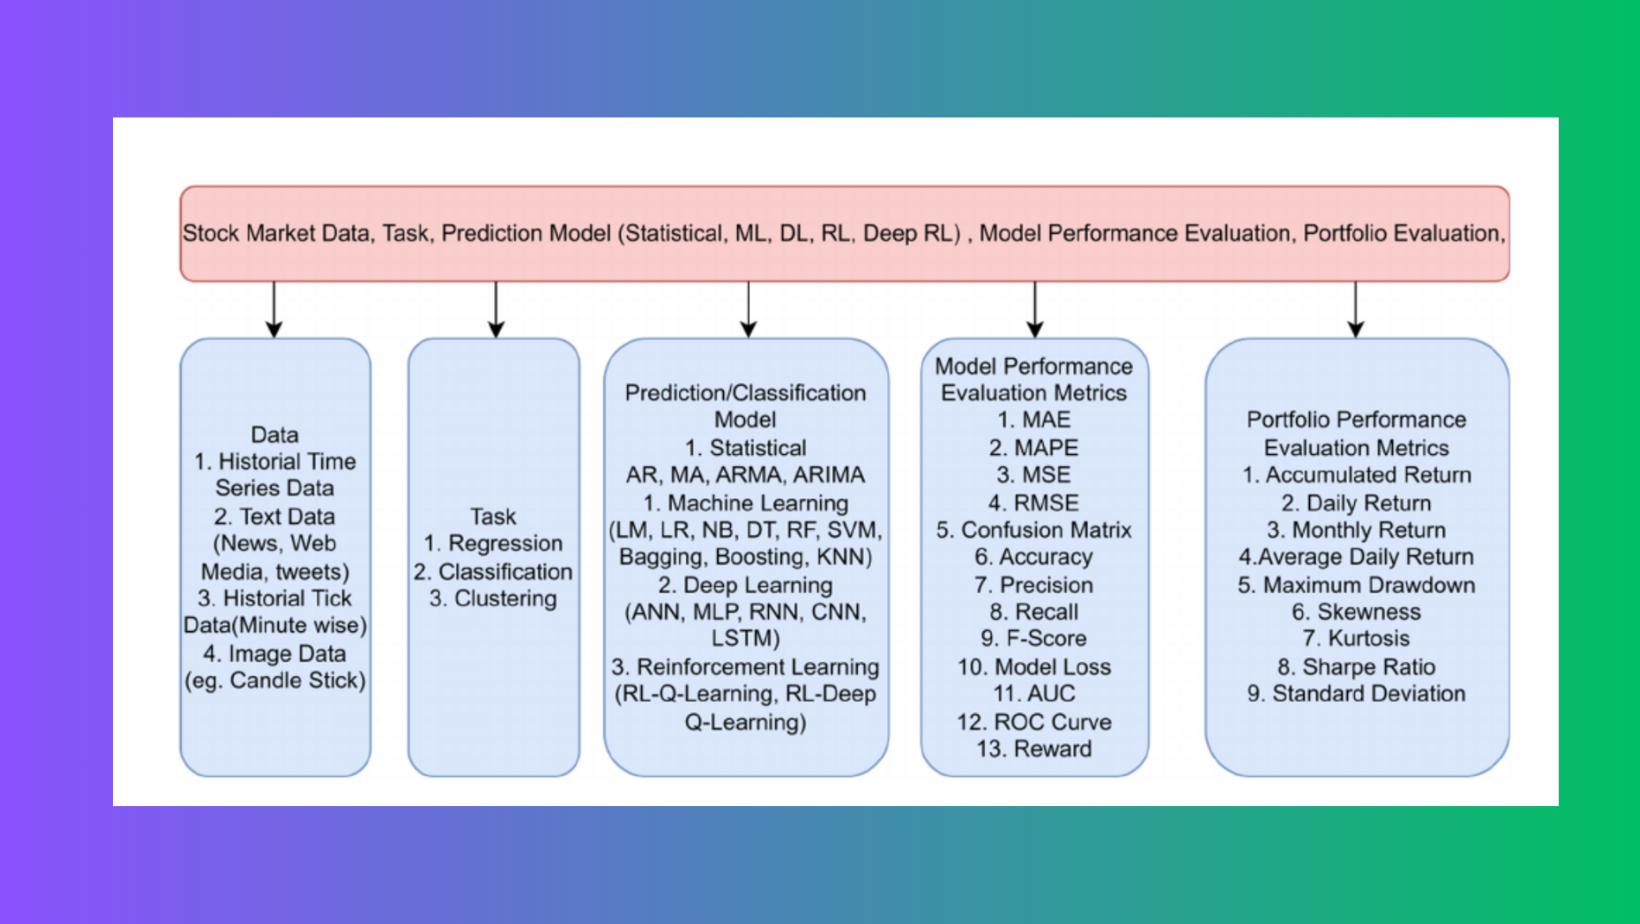
Figure above describes the overall process of the stock market using artificial intelligence.The Pipeline includes Different types of Stock Market Data, Machine Learning Tasks, Prediction Models,Model Performance Evaluation Metrics, and portfolio performance evaluation metrics.
Data and Fuel for AI Trading Models
Quality market data and insightful alpha sources power effective AI trading strategies. Models require massive datasets to uncover patterns and relationships. Popular inputs include:
Historical stock prices - Years of daily closing prices, the more the better, form the backbone of learning.
Technical indicators - Popular momentum and trend indicators like moving averages, RSI, MACD, Bollinger Bands derived from price/volume data that may forecast changes.
Fundamental data - Metrics on earnings, revenue, dividends, valuations providing a window into corporate health and prospects, influencing price action.
Economic calendars - Major events like employment reports and central bank decisions often spark volatility. Models identify impacts of specific releases.
Sentiment analysis - Gauging bullish/bearish views by analyzing news, social media, analyst notes predicts short-term moves.
Data preprocessing - Techniques including feature scaling, normalization, dimensionality reduction prepare data for modeling.
Evaluating ML Models for Trading
Many machine learning (ML) systems, especially deep neural networks, behave as "black boxes" since their complex inner workings are difficult to fully understand once trained. ML addresses three core problem types - classification, regression, and clustering.
Linear Regression (for regression problems) and Decision Trees (for classification) are basic, interpretable models with few parameters that need no further explanation. In contrast, models with millions of parameters like Deep Neural Networks function as impenetrable "black boxes", even when their structure and weights are known.
With ML, computers can analyze massive volumes of information to identify valuable trends and patterns. In trading, recognizing patterns and trends is paramount. Machine learning algorithms excel at digesting huge datasets to uncover subtle patterns that elude humans. Properly trained models can classify assets and forecast prices and returns.
While simple models provide transparency, more advanced techniques like deep learning may deliver superior results despite opaqueness. The ability to self-optimize to complex market structures through massive data and computing power is transforming quantitative trading.
Target Tasks for ML in Finance
Prediction - Stock price forecasting aims to generate profits by predicting future asset values. Forecasting is challenging due to numerous influencing factors that interact in complex, dynamic ways over time. Machine learning regression models aim to extract patterns from historical data to forecast continuous values like prices.
Classification - Recommendation models categorize stocks into discrete labels to guide investment decisions. A major difficulty is class imbalance, as the "HOLD" label dominates while signals like "STRONG BUY" are rare. Properly handling uneven distributions is important for useful recommendations.
Both prediction and classification target extracting valuable insights from patterns in historical data. However, prediction faces greater hurdles due to dependence on unknown future events. Proper model selection and development is needed to overcome obstacles in these important quantitative finance problems.
Applying Neural Networks to Multi-Factor Stock Selection
There is often a complex, nonlinear relationship between stock price movements and various influencing factors. This high-dimensional problem poses challenges for traditional models.
Deep learning excels in such scenarios through its ability to model intricate patterns across huge datasets. Properly structured deep learning models may uncover valuable insights from multiple factors.
Researching multi-input deep learning models for stock selection and trading strategies tailored for real-world markets has important implications. Networks could integrate diverse data sources for more hol hol holistic due diligence.
With further study, neural networks may generate profits by selecting stocks based on integrated fundamental, technical and alternative datasets. Outperforming conventional single-factor strategies would represent a major achievement with practical applications for investors.
Gated Recurrent Unit (GRU) Neural Network
Deep learning, especially recurrent models, has transformed financial market prediction globally. Popular choices include long short-term memory (LSTM) networks, convolutional neural networks (CNNs), and recurrent neural networks (RNNs).
GRU networks are a type of RNN with gating mechanisms that simplify training. Like RNNs, GRUs have links between time steps, enabling the modeling of temporal dependencies in sequence data.
A GRU contains two gating units - a reset gate and an update gate that determine how much past information to discard. This helps address the vanishing gradient problem of standard RNNs.
Key advantages of GRUs include their ability to:
Effectively capture long-term dependencies through gating
Be easier to train than LSTMs due to having fewer parameters
Still retain the power of LSTMs for sequence modeling
Potential drawbacks include difficulty indexing memory during read/write operations. Overall, GRUs represent a powerful RNN variant for financial applications involving time series modeling of nonlinear relationships in sequential data like prices, news, and indicators. Their training efficiency also makes them attractive for large financial datasets.
GRU Architecture in Action
A Gated Recurrent Unit (GRU) neural network is a type of RNN with strong ability to learn and predict time series data. Compared to traditional multi-layer perceptron (MLP) models, RNNs consider the sequential nature of samples during training, making them more suitable for stock price prediction.
However, RNNs face the problem of "gradient disappearance" or "explosion" during error backpropagation due to continuous derivative multiplication. To address this, long short-term memory (LSTM) networks were proposed based on the human brain's forgetting mechanism. LSTMs introduce input, output and forget gates to solve RNN's issues. The cell state carries information from all previous states and is updated at each new time step. LSTMs selectively memorize information through gate states, realizing long-term memory and forgetting functions.
While LSTMs achieve ideal prediction, their training is slow with low computational efficiency due to many parameters. As an improved LSTM model, GRU networks can overcome RNNs' limitations in long sequence prediction while simplifying the model structure and reducing parameters without degrading LSTM prediction performance.
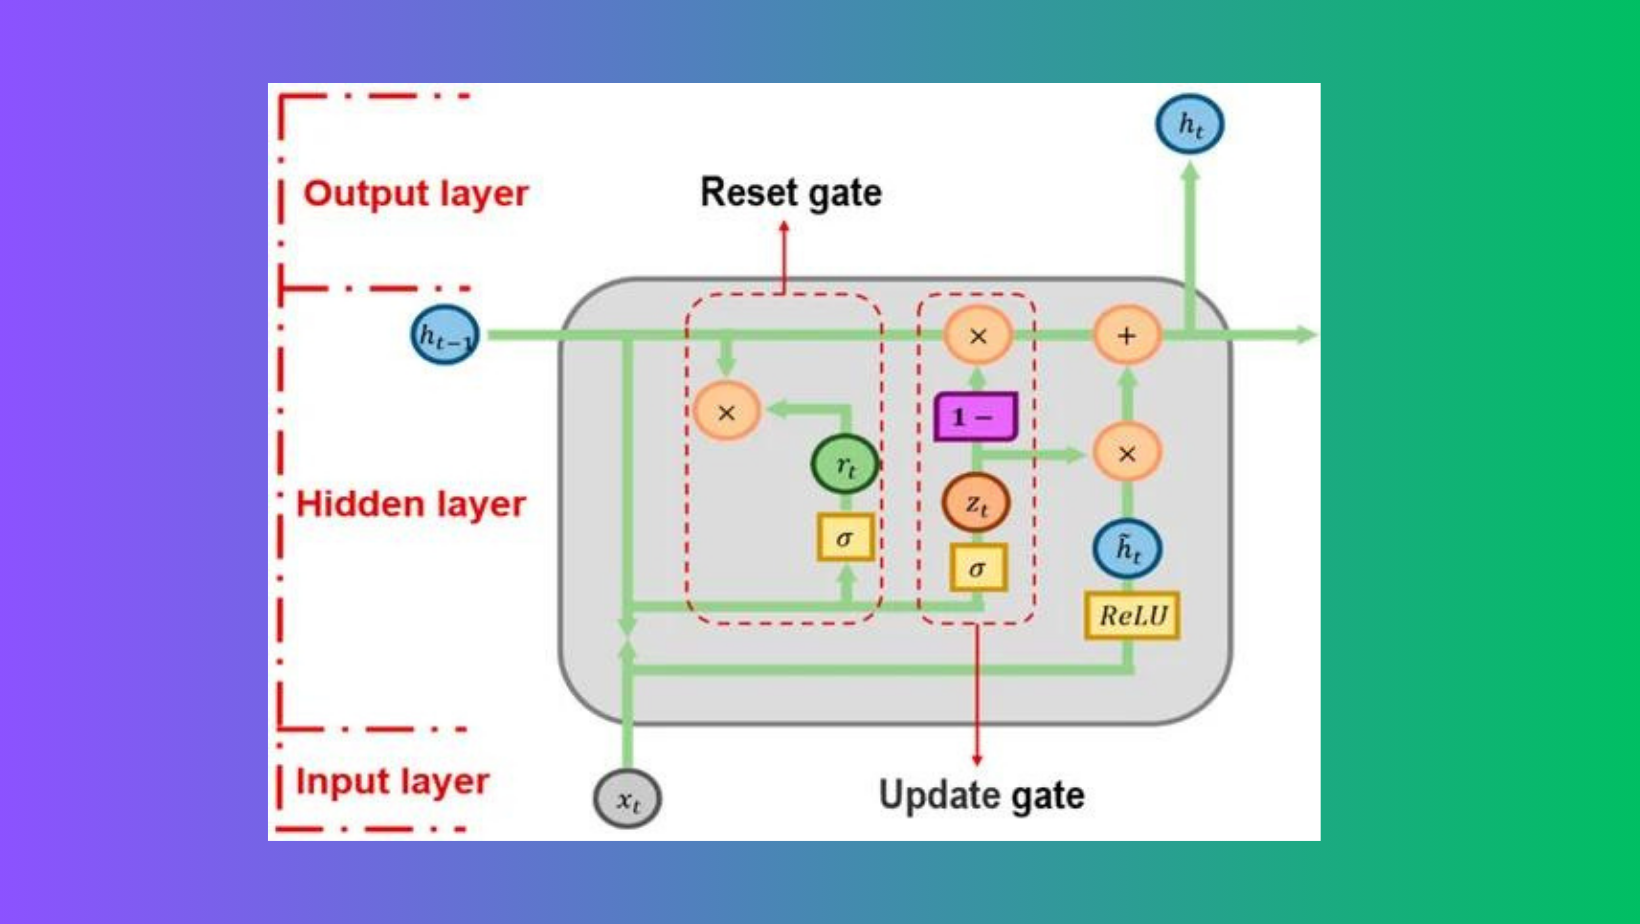
As shown in Figure, the GRU principle contains only two gates: the update and reset gates. Given current input xt and previous hidden node state ht-1 containing prior information, the update gate determines how much past information is kept, while the reset gate determines how much past information is discarded. This allows GRUs to effectively capture long-term dependencies through gating.
Putting the Model to the Test
To evaluate real-world effectiveness, researchers back-tested a quantitative strategy based on their optimized multi-factor GRU neural network model.
The results were impressive. Over the test period, the AI-powered strategy generated:
- A Sharpe ratio of 127.08% - A key risk-adjusted return metric, significantly higher than standard benchmarks.
- An annualized return of 40.66% - Far exceeding overall market returns.
- An excess return of 13.13% - How much additional profit was realized compared to the market baseline.
- A maximum drawdown of only 17.38% - Indicating relatively low downside risk.
By numerous performance measures, the model-driven approach clearly outperformed traditional investing over the back-test time frame. This underscores the potential of advanced AI to deliver profits through optimized stock selection.
Selecting the Right Variables
For any AI model to generate meaningful results, it requires high-quality input data. The variables chosen must be both unique yet highly relevant to the target outcome.
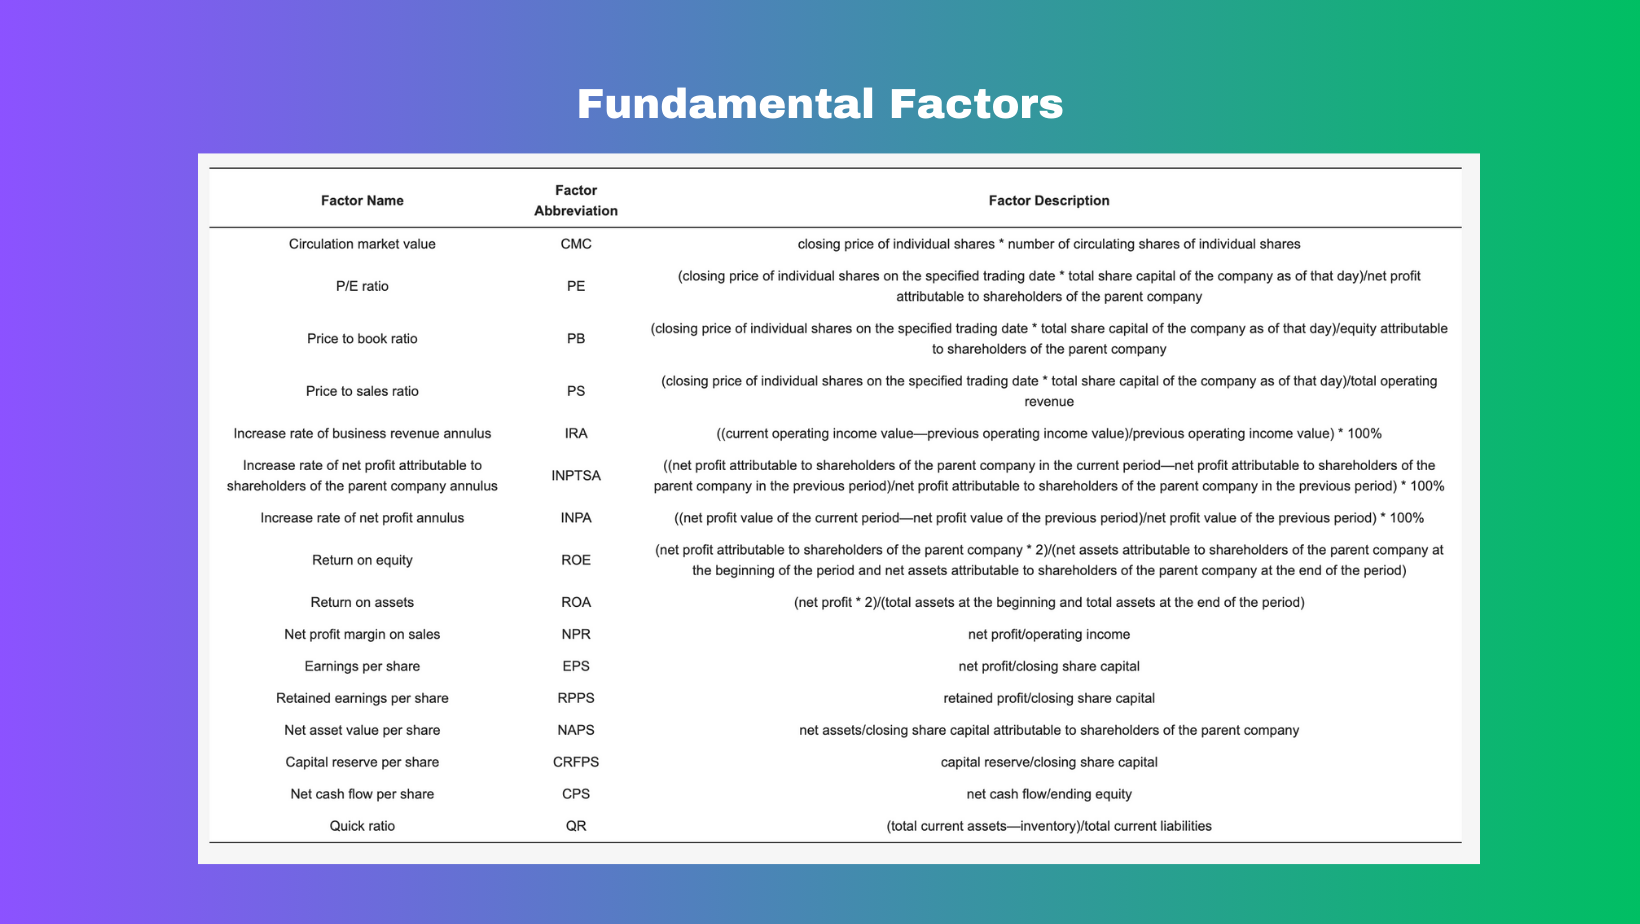
This recent study draws on 16 key financial indicators like market cap and P/E ratio to capture stock valuation, profitability, growth and financial strength. Those specific financial indicator sources are depicted below:
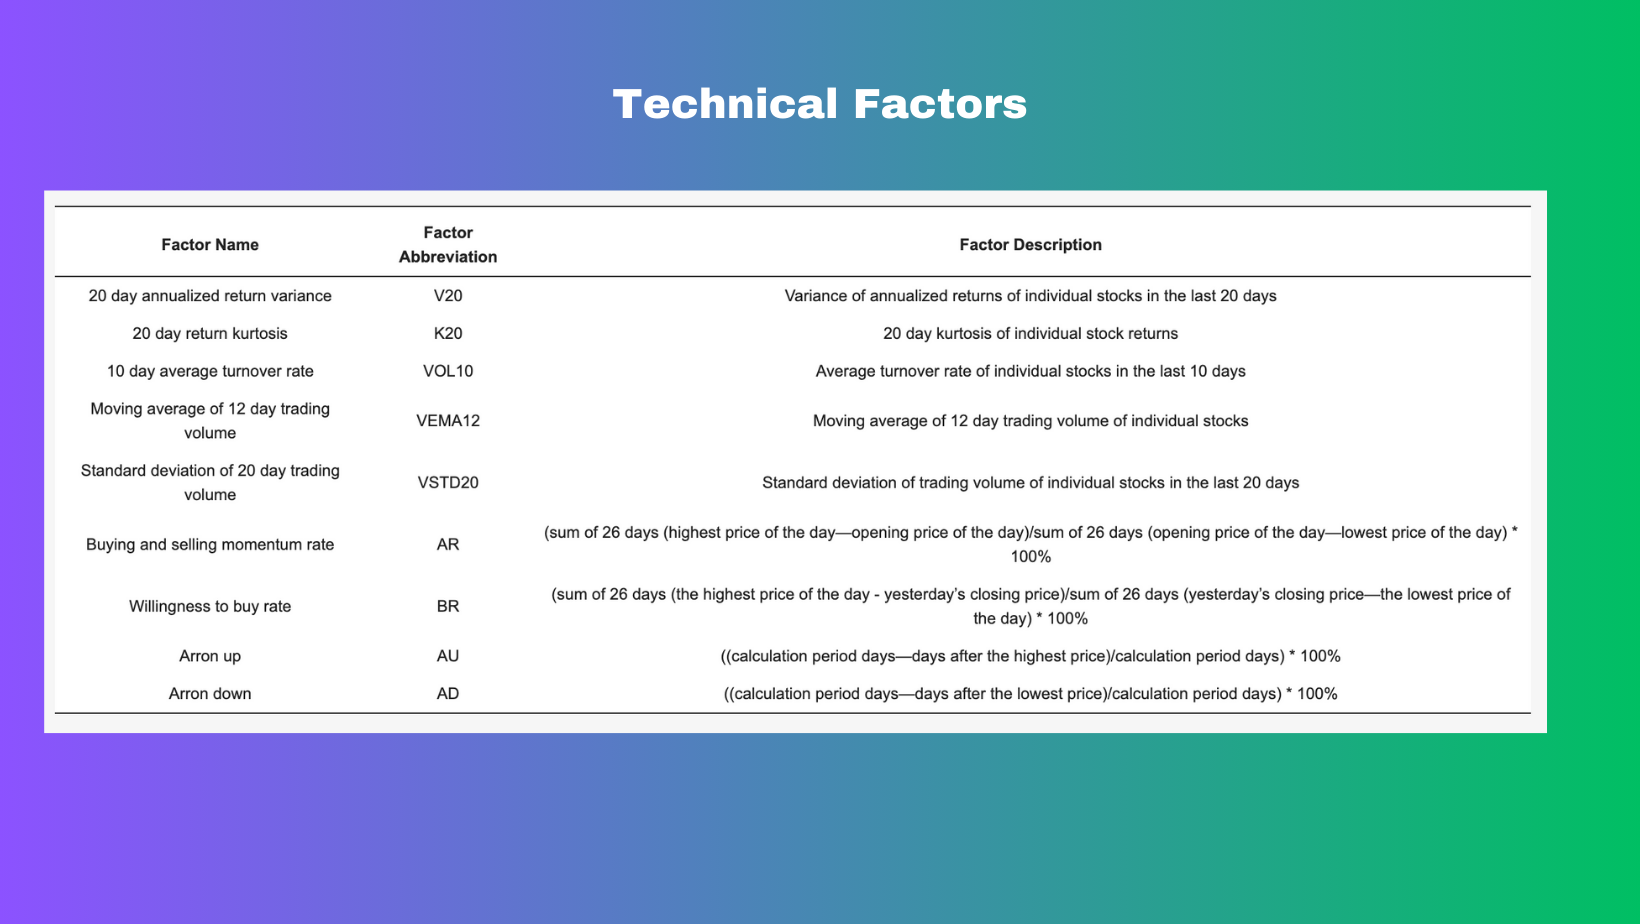
The figure provides details of 9 technical factors such as 20-day return variance and 10-day average turnover that are included to represent volatility, trading volume and momentum.
Beyond fundamentals and trends, the impact of public opinion on investor sentiment and confidence is also considered. An innovative Sentiment Index can be generated through daily news analysis using Python tools.
By integrating diverse sources, the model aims to develop a more well-rounded view of factors shaping stock behavior for optimized selection. Quality input data serves as the foundation for powerful AI strategies.
Deep Learning Model Architecture and Optimization
The selection of parameters has a major impact on a neural network's predictive ability. The recent GRU paper uses the Cuckoo Search algorithm, known for its strong optimization, to refine the GRU network architecture and develop an innovative CS-GRU stock selection model.
The initial GRU network contains:
- 4 hidden layers, including 1 GRU layer and 3 fully connected layers
- Dropout of 0.5 added between layers to prevent overfitting
- ReLU activation between GRU and first fully connected layer
- ReLU also between fully connected layers
- Softmax activation between last fully connected and output layers
Node counts for the input, output, and 4 hidden layers are optimized. The hidden layers were initially set to 10, 30, 20, and 15 nodes respectively.
Next, Cuckoo Search optimizes the node counts. Parameters include:
- Nest discovery probability of 0.25
- Step scaling factor of 0.1
- β coefficient of 1.5
- Population size of 18
Trading Strategy
On adjustment dates, the model selects the 10 stocks with the highest predicted rise probabilities to form the portfolio. It sells existing holdings and replaces them with the new top 10 stocks based on predicted changes. Backtesting compares the AI-powered strategy against the CSI 300 index over the test period, evaluating performance.
Model Training and Parameter Tuning
This next goal is to refine the proposed CS-GRU network architecture.
For training the GRU network, this study selects:
- Cross-entropy loss function
- Adam optimizer for updating weights and biases during backpropagation
- Learning rate of 0.005 to gradually optimize parameters and prevent overfitting
- 500 training rounds
- Batch size of 50 for each round
The Cuckoo Search algorithm optimizes the number of nodes in the:
- GRU layer
- Three fully connected layers
During parameter optimization:
- Maximum iterations is set to 100
- Value range for the 4 optimized parameters (node counts) is [0,200]
This extensive tuning process refined the model architecture and hyperparameters. It aimed to develop the most effective CS-GRU stock selection model for predicting stock price movements.
The Importance of Backtesting Models
Backtesting is essential for evaluating Machine Learning models designed for stock trading. It involves using historical market data to simulate how a model would have performed in the past. This helps identify unsuitable strategies before live trading.
There are two main approaches:
- Walk-forward backtesting uses data in chronological order to simulate actual trading decisions. While it doesn't guarantee future results, it evaluates how the system would have operated historically.
- Data splitting trains on one sample and tests on another from a different time period. Both remove the need for cross-validation with time series data.
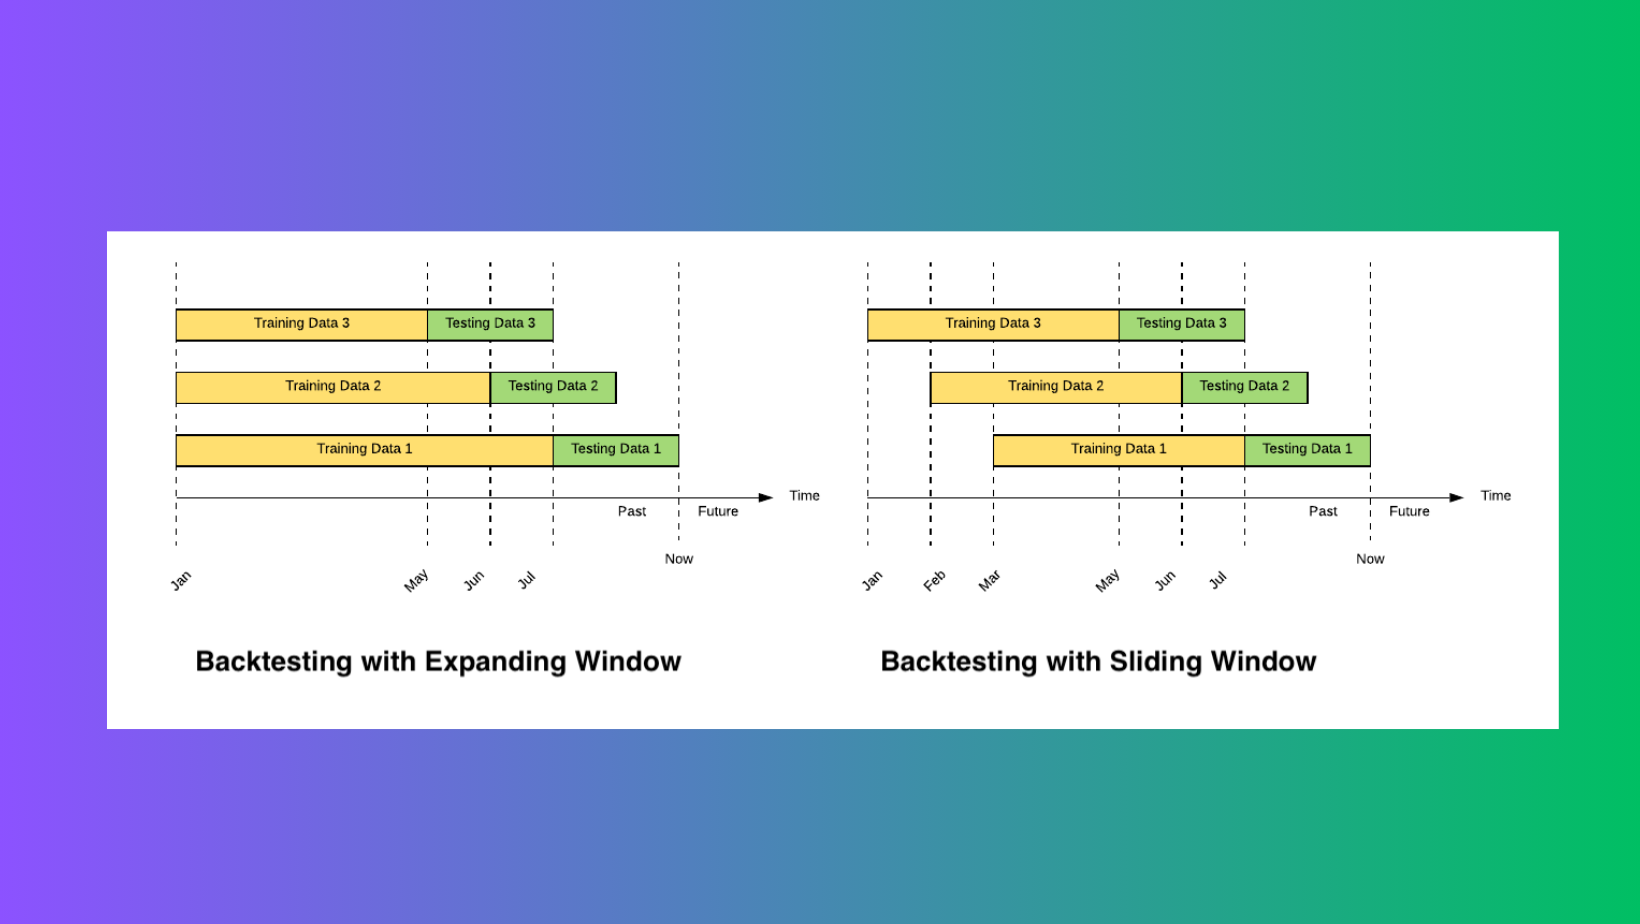
Sliding window is similar to walk-forward but uses a fixed-size window that slides through time. For example, training on data from 2010-2015 and testing on 2015-2020, then shifting to 2011-2016 and testing on 2016-2021. Sliding window helps address concerns about overfitting to specific events. By continuously re-training and testing on new periods, it assesses consistency over a long time frame.
Proper backtesting is key but also difficult. We must test on unbiased, long-term data to fairly assess the model. Overfitting is a major concern, where a model performs well on training data but poorly on new information. Researchers should not fine-tune models in response to specific events, like the 1998 recession or 2020 crash. By backtesting across various historical periods, we can modify assumptions and avoid misinterpretations of a model's true abilities.
Backtesting gives investors confidence by demonstrating a strategy's consistency over time. It is a vital tool for evaluating financial models, helping to progress research, and should always be conducted with integrity.
How AI is Transforming High-Frequency Trading
High-frequency trading (HFT) makes up 70% of US equity trades by leveraging computers and algorithms to rapidly buy and sell based on small price shifts within milliseconds. While increasing market liquidity, critics argue HFT may provide unfair advantages and increase volatility.
HFT requires predicting market movements in real-time using vast amounts of data. AI and machine learning address this through their ability to recognize patterns in historical and current data to anticipate price changes. With AI, traders can spot opportunities faster than traditional systems, reducing latency costs.
Research shows AI's impact. One key study developed an algorithm analyzing factors like trading volume and spreads using deep learning. It recognized patterns to forecast short-term trends. Importantly, its adaptive learning component allowed it to update predictions as markets changed, keeping forecasts accurate.
Another study used a hybrid model combining CNNs and RNNs to leverage both spatial and temporal patterns. CNNs captured sudden price spikes, while RNNs captured temporal patterns crucial for time-series HFT data. Processing real-time data, it identified optimal times to buy and sell, achieving higher prediction accuracy than traditional methods.
The Power of AI in Financial Markets
Making accurate predictions in fast-moving financial markets is challenging. Humans are prone to missing crucial details and making costly mistakes due to emotions like fear and greed.
This is where artificial intelligence can help. AI algorithms:
- Analyze huge amounts of historical data to spot patterns and build forecasts.
- Make ultra-fast trading decisions without human biases or fatigue.
- Continuously monitor markets and respond to changes in real-time as prices move.
- Combine multiple prediction models to generate more accurate forecasts.
For traders, the benefits of AI include:
- Precision - Algorithms work methodically without errors.
- Speed - They can react and trade much faster than humans.
- Discipline - Emotions are removed, and backtested strategies are followed strictly.
- Risk management - Positions are opened and closed rapidly, and risk is diversified.
Of course, AI also has limitations. Models may struggle with atypical market conditions and technical glitches can disrupt performance. Ongoing monitoring and refinement is important.
When combined with human expertise, AI shows tremendous potential to enhance trading through its unparalleled data analysis abilities and rapid-fire decision making.
Managing Systemic Risks of AI Trading
While AI shows promise, its growing use also raises concerns about potential disruptions to financial markets. As more systems are trained on similar data and strategies, there is a risk of "herding behavior" - where algorithms collectively drive markets in the same direction. This could exacerbate volatility.
The potential for AI to act on false signals or misleading patterns also poses risks. If many systems make trades based on incorrect analysis, it could trigger drastic market moves. With AI reacting at lightning speed, effects may escalate rapidly.
Lack of transparency in complex AI models adds to uncertainty. It is difficult to understand why systems took certain actions or predict outcomes of new situations. This limits oversight and accountability.
As reliance on AI grows, managing systemic risks becomes increasingly important. Regulators face challenges around monitoring dispersed AI systems and unpredictable emergent behaviors.
AI shows potential, but its impact must be carefully studied to ensure market stability and integrity. Ongoing research aims to enhance transparency, prevent herding, and help systems distinguish real trends from anomalies. With prudent oversight, AI's benefits can be realized while mitigating risks to the financial system.
Catching Hidden Signals: How AI Drives Trading Success
Artificial intelligence is revolutionizing investing by revealing patterns humans often miss. AI and machine learning can detect complex, nonlinear relationships in data critical to strategies like high-frequency trading.
AI vastly improves decision-making by processing huge volumes of information at incredible speeds. Researchers have found integrating AI into trading:
- Enhances returns. One study found traders using AI earned higher profits than those relying on only human analysis.
- Spots timely opportunities. AI examines real-time market data to pinpoint trading signals faster than humans.
- Outperforms at HFT. With AI, opportunities can be seized within milliseconds before disappearing.
A key benefit is AI's ability to recognize trends from patterns. One review showed algorithms can identify market movements more rapidly than people.
Overall, the numbers confirm AI gives traders crucial edges. By leveraging computing power and deep learning, investors can "see" hidden signals in the data and capture ephemeral profits opportunities that traditional methods miss. The insights AI provides mean the difference between investment success and failure.