

Market declines rarely come with a clear warning. Sometimes the damage builds quietly, long before volatility catches up. Earnings estimates weaken, borrowing costs rise, or a handful of influential stocks begin to lose momentum while the broader index holds up. By the time daily price swings attract attention, an investor may already be nursing a sizeable loss.
That question feels timely in October 2026. Investors are balancing the strength of large US equity indices, including the S&P 500 and Nasdaq, against higher financing costs and uncertainty around inflation and monetary policy. Gold can provide useful diversification when confidence in other financial assets weakens, although its short-term performance also depends on real yields and the dollar. Currency moves add another layer, particularly for portfolios with international exposure. There is plenty to think about without assuming that any one of these markets is about to reverse.
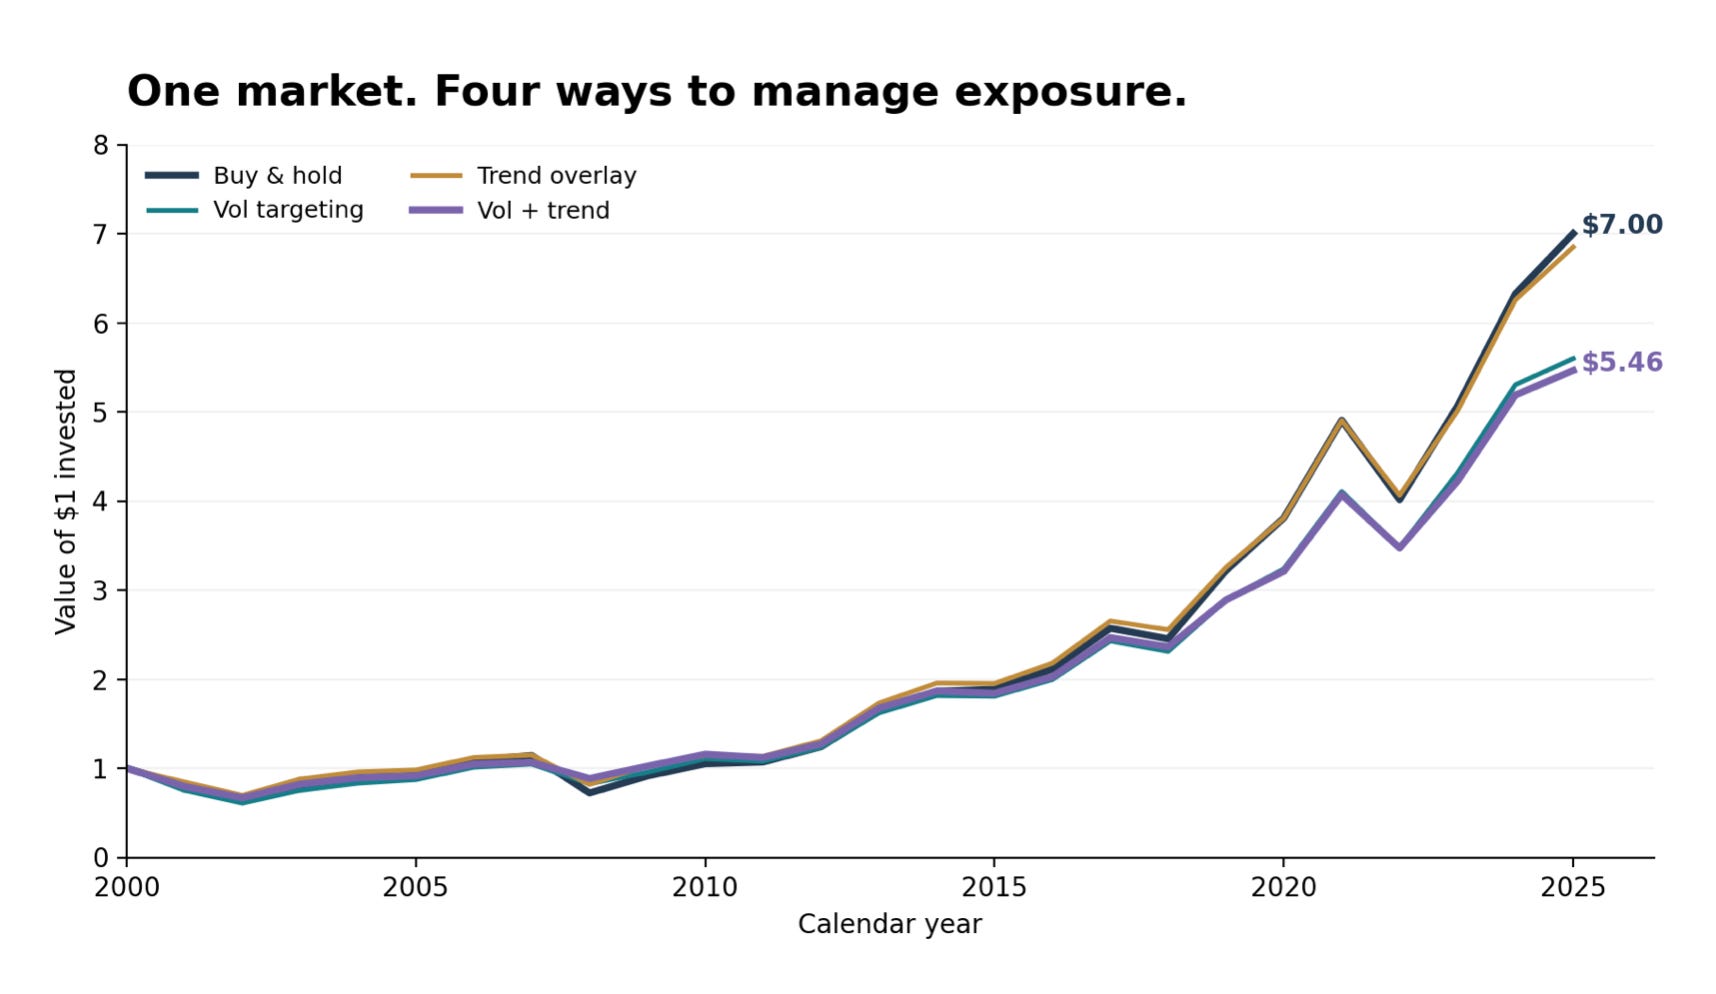
I wanted to know how much difference a simple, mechanical change in equity exposure would have made over a full cycle. I tested four portfolio rules on more than 25 years of daily SPY data. The lowest-drawdown approach cushioned the worst losses, but an investor who followed it ended up with less money than someone who stayed fully invested. The trade-off is substantial enough to deserve a close look.
The exercise begins with two familiar pieces of information: recent price volatility and the longer-term market trend. Volatility can rise quickly during a shock; a trend measure can pick up a slower deterioration. I tested what each contributes, then what happens when the two are used together. Later, I consider what a cross-asset perspective might add.