

Markets do not follow one stable return distribution. Volatility, drift and correlation can change across periods, and Hidden Markov Models provide one probabilistic way to describe those latent states. A fitted state is not automatically a trade signal: its usefulness depends on identification stability, point-in-time implementation and performance against simpler benchmarks.

In this study, I use a simple 3-state Gaussian HMM to classify intraday market regimes (uptrend, downtrend, sideways) using only 5-minute return bars. We avoid technical indicators, economic data, or fundamentals. The goal is to test whether a clean price-driven signal can produce actionable regime classifications. It can.The experiment uses five-minute data for six U.S. mega-cap stocks from early April to early June 2025. Its reported annualised daily Sharpe estimate of 5.9 is unusually high, but the sample is short and concentrated, turnover is substantial and the result is measured before fees, spread, slippage and market impact. It should be read as a diagnostic result that requires further testing—not as an estimate of deployable performance.
Why Hidden Markov Models?
A Hidden Markov Model is a probabilistic model where the system being modeled is assumed to follow a Markov process with unobservable ("hidden") states. In financial contexts, HMMs help identify latent market conditions that influence observable price changes.
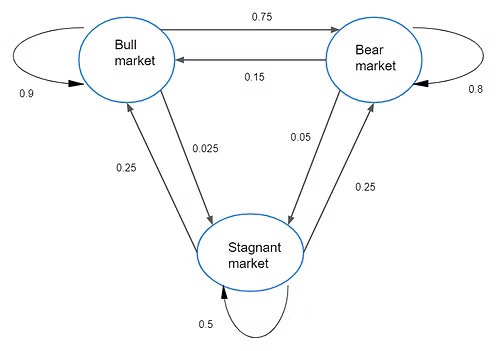
HMMs model systems where you observe outcomes (like price returns) but the underlying state (market regime) is hidden. Each regime generates returns with its own statistical profile. The model estimates:
Transition probabilities between regimes
Emission probabilities of returns within each regime