

Markets rarely move on cold rationality alone. They pulse with the collective nerves of their participants — where anxiety feeds on itself and optimism snowballs into euphoria. Any quantitative model that pretends otherwise ignores something essential about how markets actually behave.
Crowd psychology is a latent variable with measurable proxies. The Fear & Greed Index is CNN's attempt to operationalize it: seven market signals, compressed daily into a single score between 0 and 100, mapping the collective emotional position of participants against their own history.
The empirical record across time horizons is more structured than the skeptics assume and more fragile than the believers admit. What the index actually measures, its predictive power across different time horizons, and — most importantly, where it violently unravels — that's what this piece is about.
The Emotional Anatomy of a Market Cycle
Before examining the index’s construction, it is worth grounding the discussion in the behavioural mechanism it is designed to detect. Market cycles are not purely technical phenomena. They are also emotional ones, and the sequence of psychological states that investors move through — from disbelief to optimism, euphoria, overconfidence, and eventually panic and depression — has a documented and remarkably consistent structure across different asset classes and time periods.
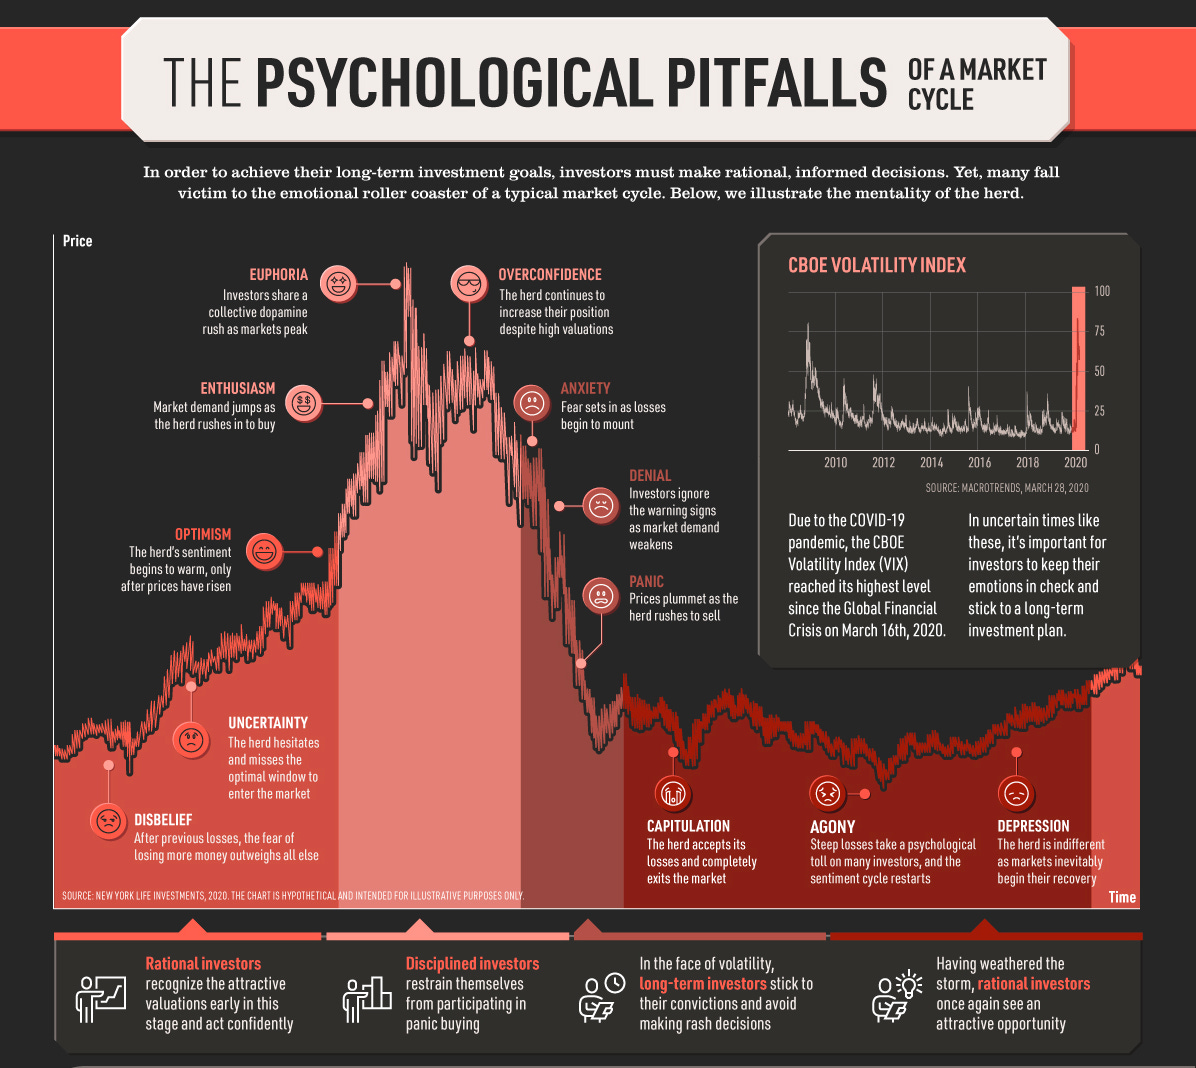
The diagram above makes visible a structural asymmetry that is easy to state but hard to act on: rational investors who recognise undervaluation at the disbelief and uncertainty stages are separated from those who capitulate near the bottom by nothing more than information and emotional discipline. The Fear & Greed Index is, in essence, a systematic attempt to quantify where on this cycle the aggregate market currently sits — replacing the anecdote with a number.