
Forget the AI Bubble Debate. The 2026 Bull Case Is $8 Trillion Boring.
A 9.1% drawdown healed in eleven days. The same shock in 2000 took eleven hundred. Why the floor under them keeps climbing — and what that tells you about the next sell-off.

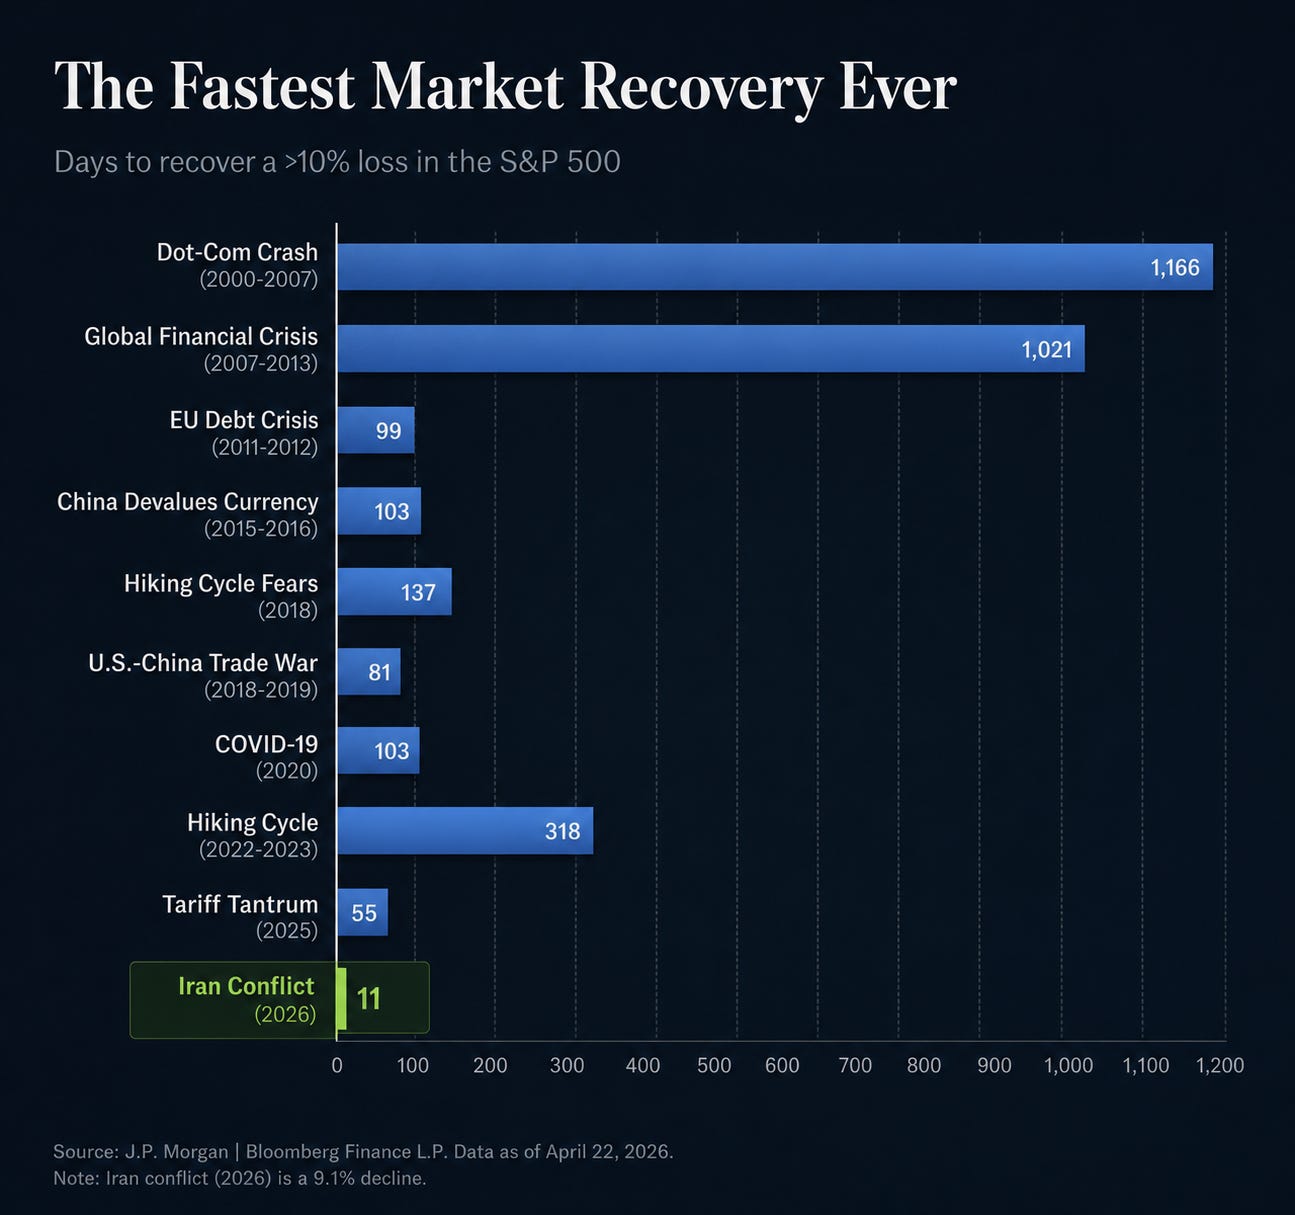
Eleven days. That is how long the S&P 500 needed to repair a 9.1% drawdown after the Iran shock — a hole filled and forgotten before most macro desks had finished writing about it. The same depth of pullback in 2000 took eleven hundred days to mend. Same country, same index, three orders of magnitude apart in healing speed.
Wall Street has spent six months arguing about whether this is the dot-com bubble in fancier clothing or a real productivity boom. I think both camps are debating the wrong variable. The interesting question in May isn’t where the price is. It’s where the bid is. And once you see where the bid is sitting — how much of it, at what yield, with what alternative — the midyear setup stops looking like a valuation argument and starts looking like a question of who exits first, and into what.
Both Camps Are Arguing About the Wrong Thing
Let me describe the debate as it actually exists in the major sell-side notes right now, because the framing is what’s broken.
The bubble camp points at concentration. Cap-weighted S&P is beating equal-weighted by the widest six-week margin since the late 1990s. AI capex commitments are running near a trillion dollars annualized. Hyperscaler multiples imply roughly perfect execution for a decade. These aren’t bad observations. They’re correct. But bubbles rarely end because the concerns were wrong.
The boom camp answers — also correctly — that 16–25x forward earnings is not the 200x Cisco multiple of March 2000, that the cash flows behind the AI thesis are real and growing fast, and that the four megacaps doing the heavy lifting produce more annual free cash flow than the GDP of every country outside the top dozen.
Both sides are interrogating the price. Neither is interrogating the pool the price is drawn from. The pool is where the regime change lives, and the chart below is the cleanest summary of it in one frame.
What collapsed in 2000 was beyond price - the market where every retail account, every pension allocation, every late-cycle margin balance was already long. The reservoir on the bid was empty. The structural inverse of that situation is the entire 2026 thesis.