

The U.S. midterms are four days away. The familiar stock-market chart is already circulating: after previous midterm elections, the S&P 500 supposedly followed a remarkably dependable path higher. It’s the sort of statistic that sounds reassuring when an index is near record territory.
I’ve been spending more time looking at gold. The pullback has made the entry price interesting again, particularly for investors who see gold as a longer-term holding rather than a quick trade. Central-bank reserve decisions, the dollar and the direction of real interest rates all belong in that discussion. An election calendar alone cannot settle it.
So I went back through the midterms from 1978 to 2022 and put gold beside the S&P 500. I kept the dates identical and focused on next few months, the stretch directly ahead of us.
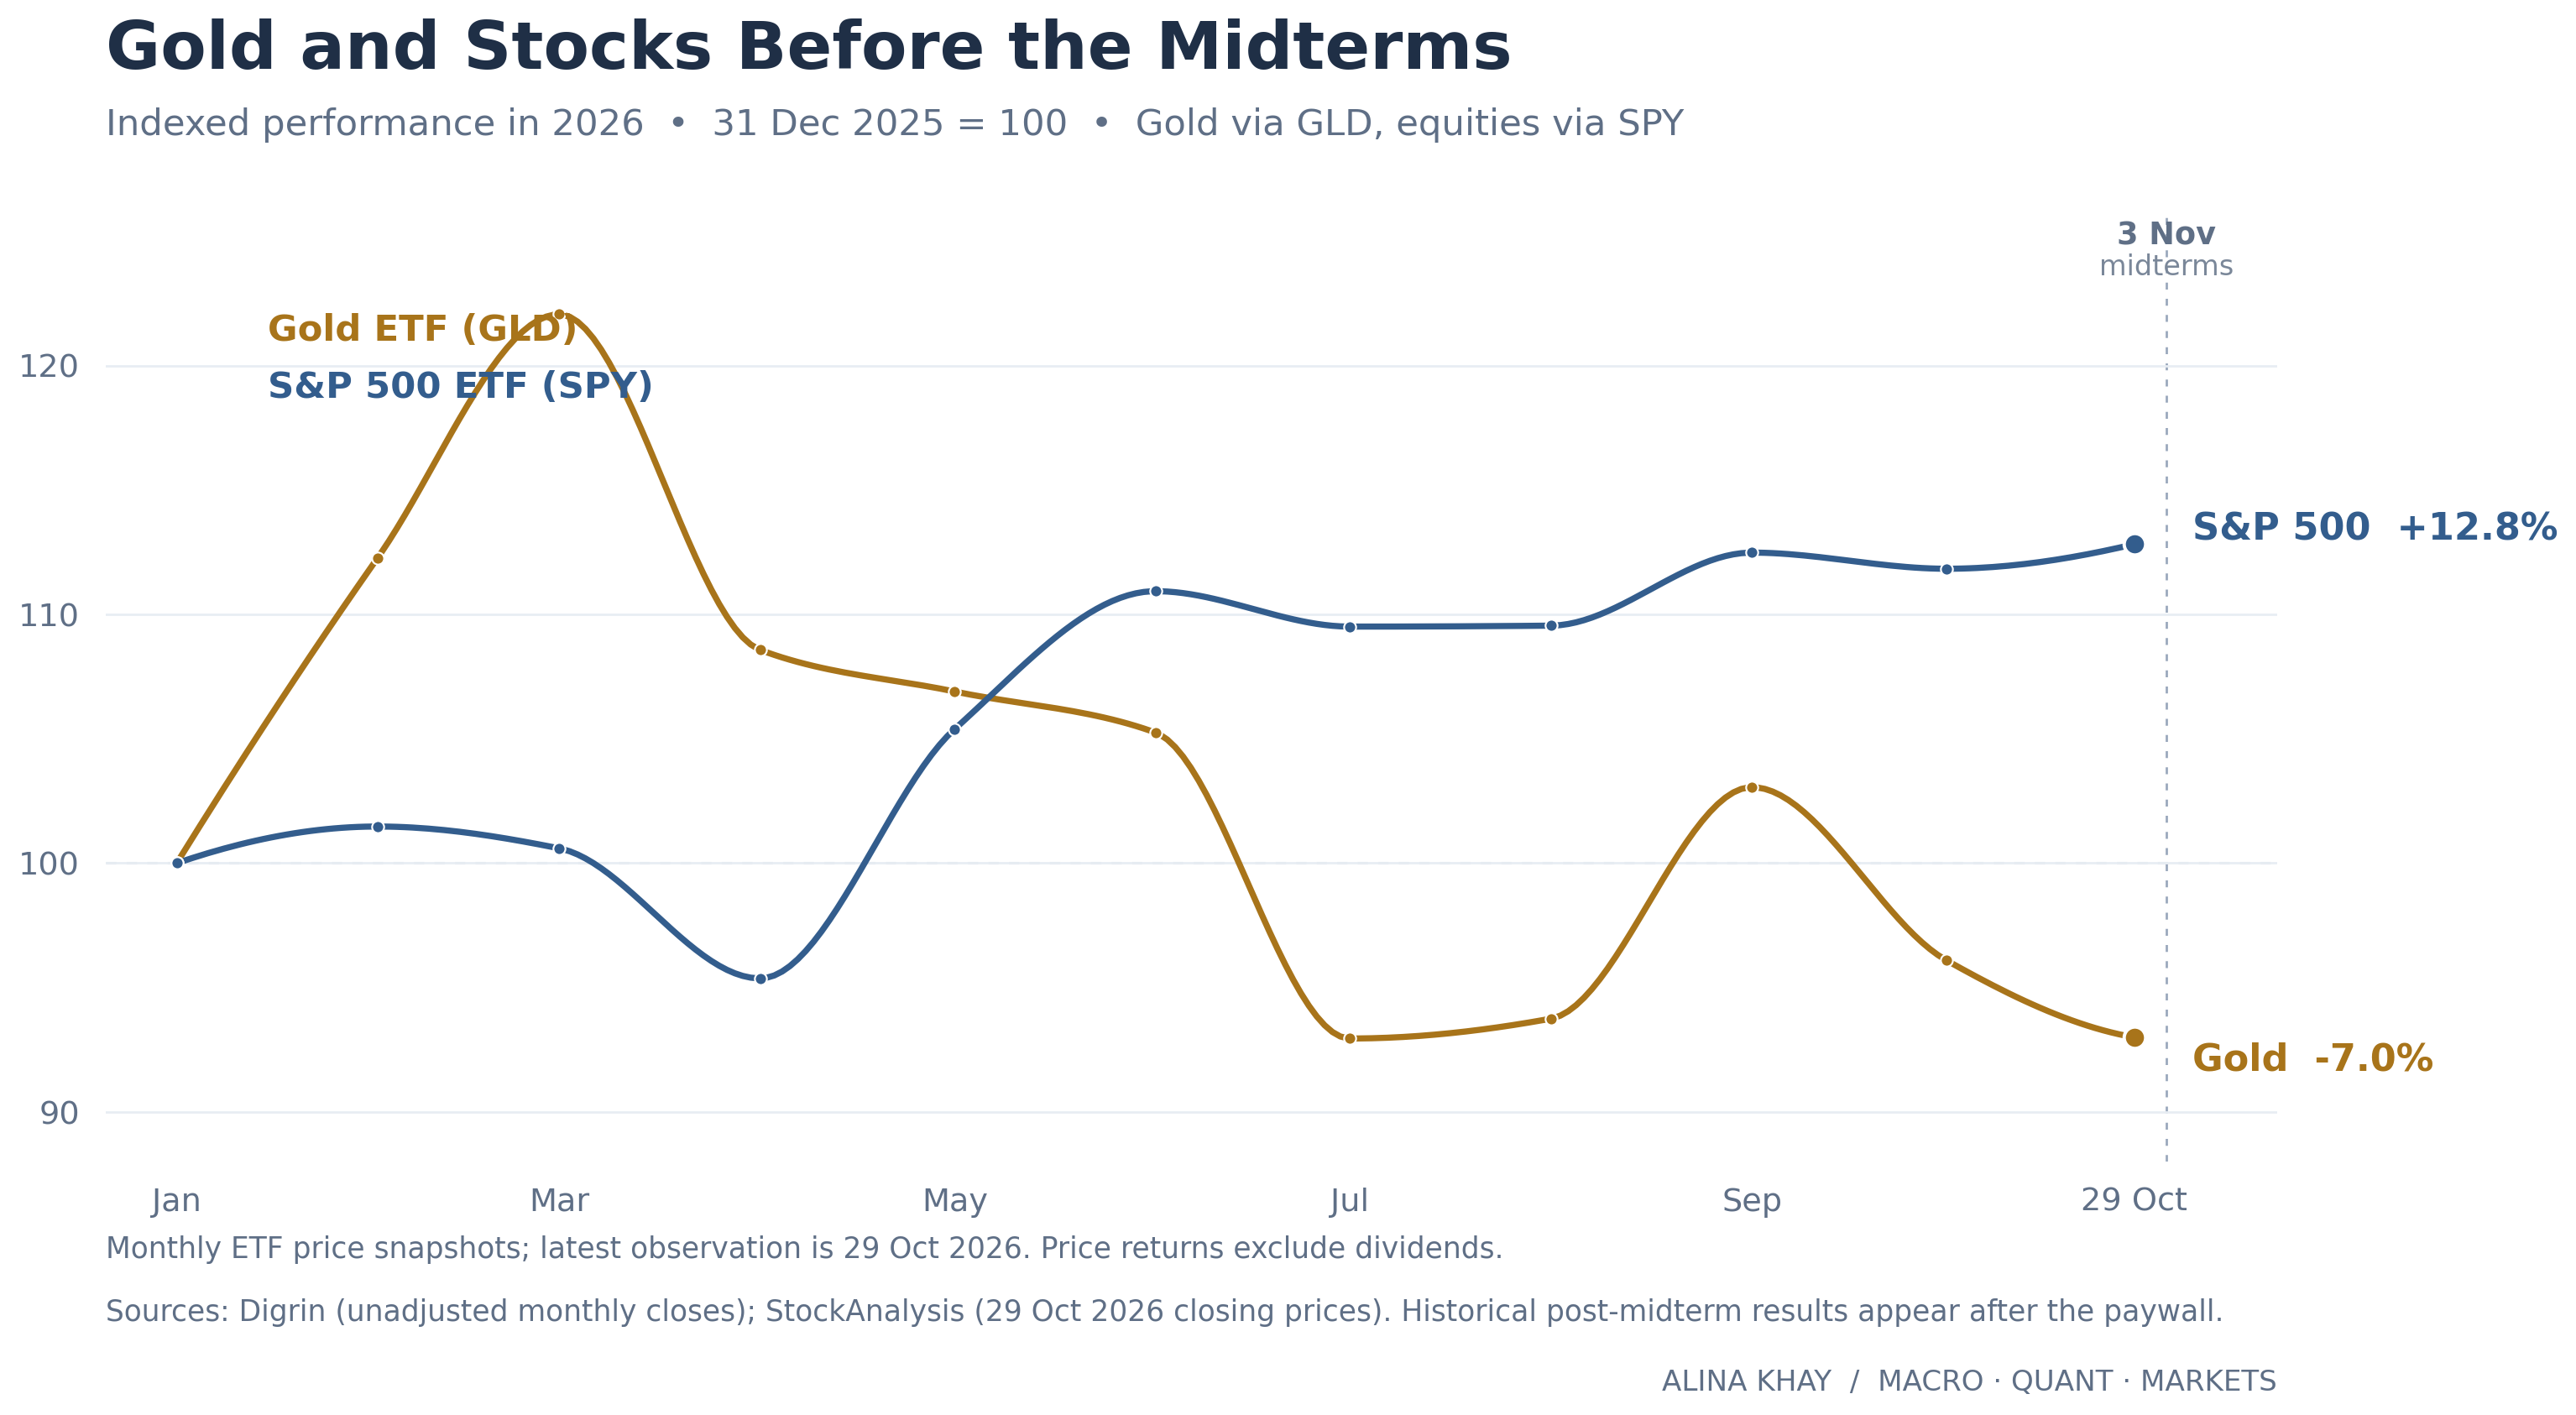
I wanted to know whether gold’s record was being overlooked in all the excitement about equities. I also wanted to see which years drove the results, especially when the stock market was having a difficult winter.
The complete comparison, figures and implications for the present market follow below.