
Markets Priced for Perfection in May 2026. What Comes Next
What to Watch vs What to Trade

On April 24, the S&P 500 closed at all-time highs. The VIX had collapsed from 27.4 to 19.3 in under three weeks. Simultaneously: Hormuz remains partially closed (H2 reopening unlikely per Baker Hughes), hyperscalers are committing $782 billion in untested capex, and a new Fed chair takes office in five weeks. The market is serene. The risks are not.
This chart is a description of where we are right now — a volatility regime score of −1.19, confirmed low, the most compressed reading since August 2025. The last two times the regime score spiked from this depth, the S&P fell 7% inside ten trading days. In this article I analyse why the third time may follow the same path, and what to do about it.
Realized vs. Implied Volatility
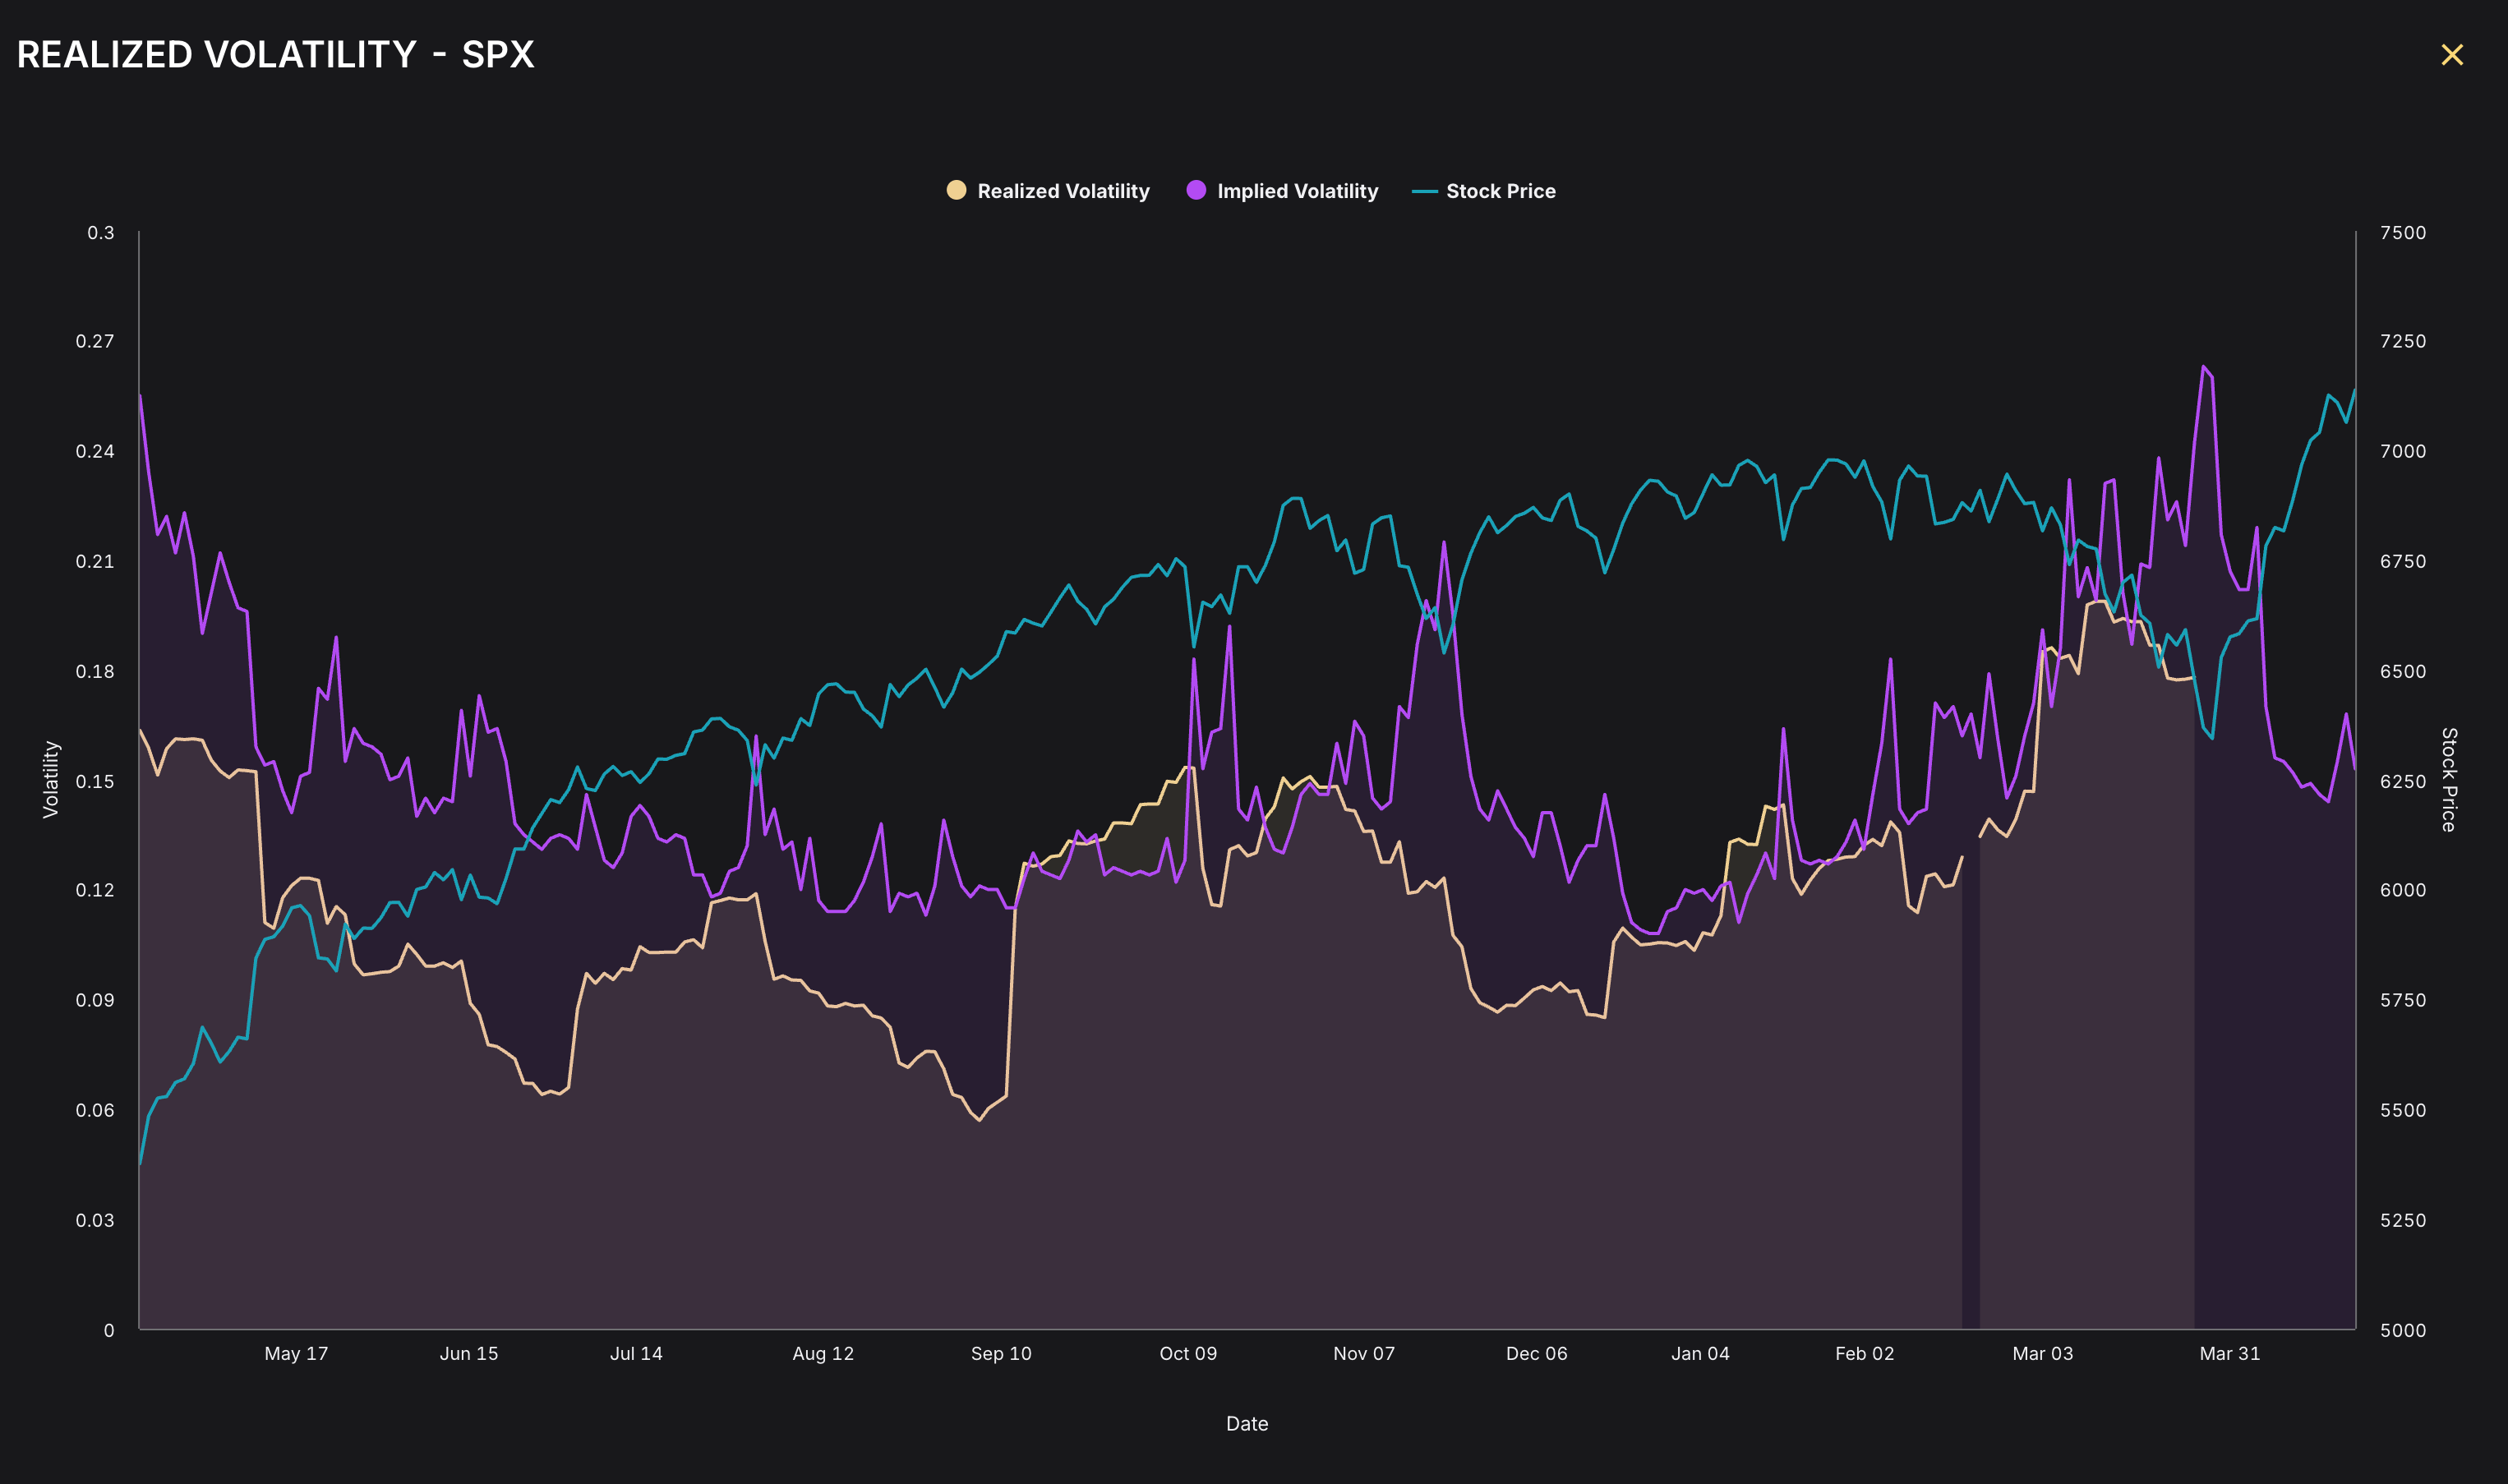
The area between implied and realized vol is the variance risk premium — essentially what options sellers earn for supplying insurance. Through most of 2025, realized vol ran well below implied, rewarding vol-selling strategies and training systematic desks to fade spikes. The March 2026 spike (IV to ~27%) was the first genuine regime test. It reversed in under three weeks. That reversal speed is itself a risk signal: markets that recover fastest from fear tend to be most overconfident at the next shock.
Why does this matter? Because options market structure creates forced buying when realized vol spikes above implied. When dealers are systematically short gamma (short volatility insurance), they must buy to re-hedge as the underlying rises. This buying is self-reinforcing—it accelerates the move upward. But when vol crashes below expected levels and dealers unwind, they must sell simultaneously across the entire options strip. The snapback is not driven by fundamentals. It's driven by dealer positions reversing in concert. When gamma unwind starts, it moves fast and it moves all at once.
Current Regime: LOW (−1.19) — A Quantitative Warning Signal
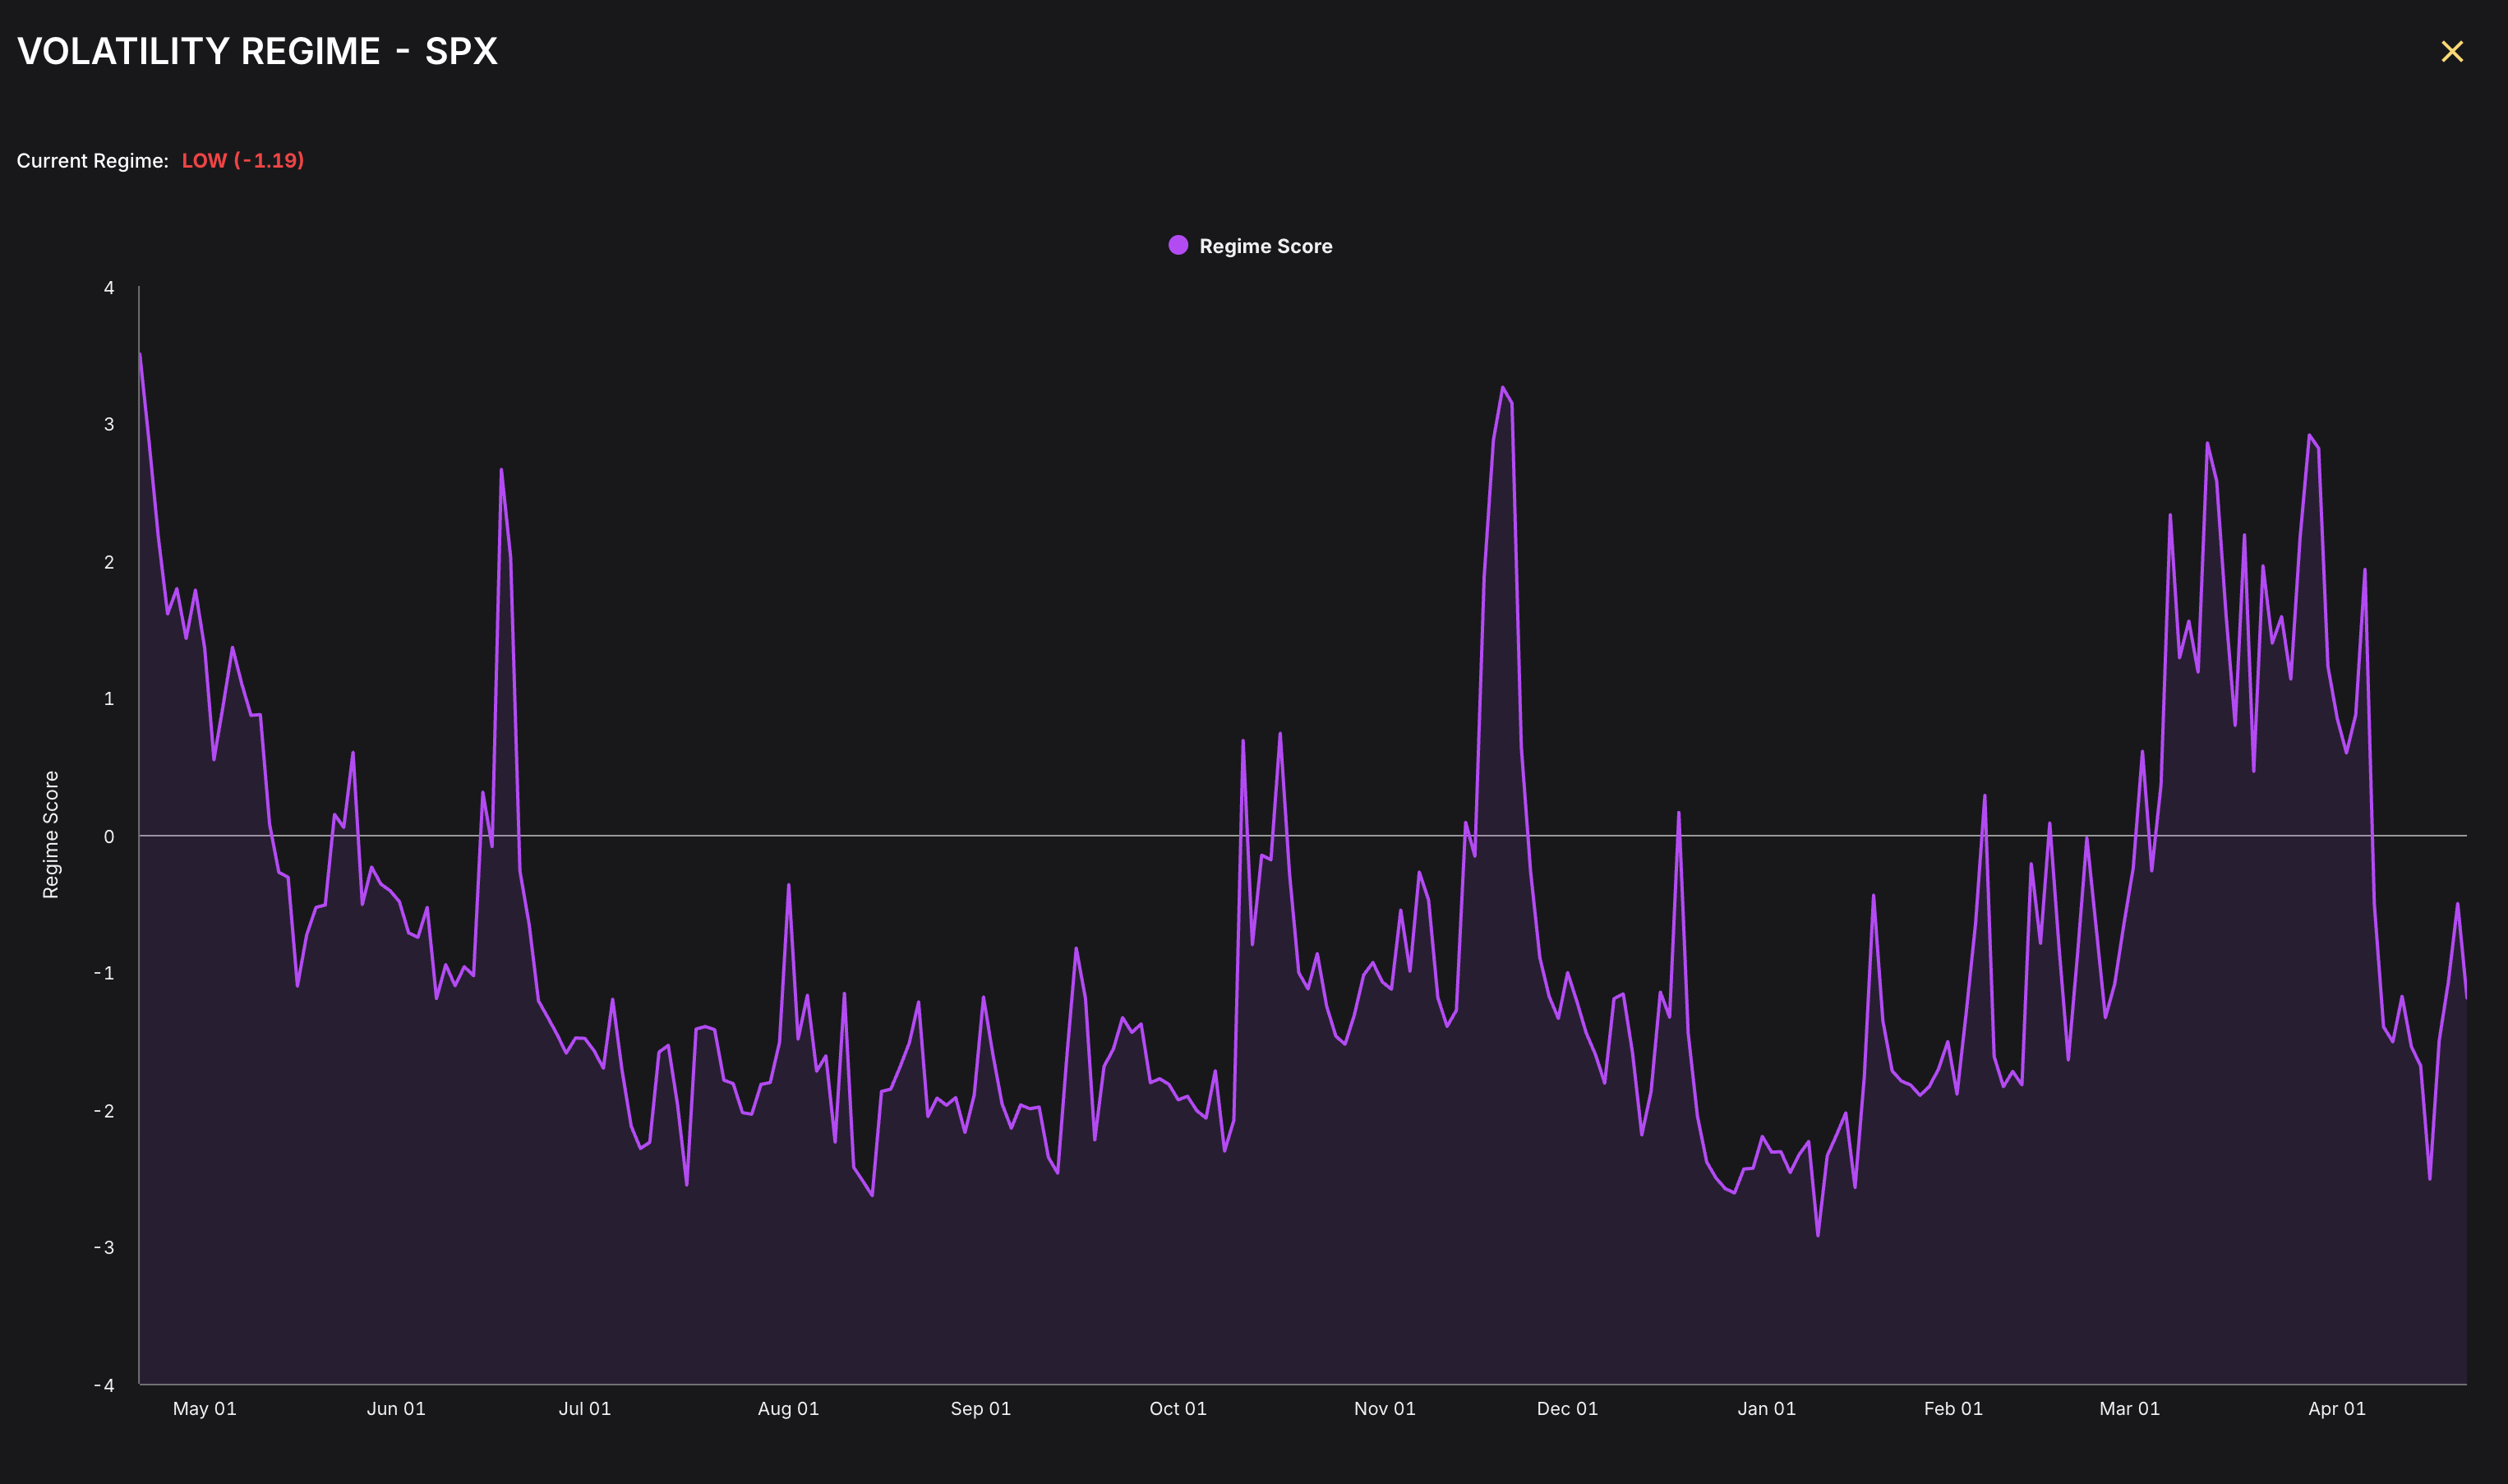
The regime score synthesizes multiple vol signals — term structure, skew, realized/implied spread — into a single composite. A score of −1.19 means the system is in a confirmed LOW volatility regime, one of the most compressed readings of the past twelve months. Historically, regimes this compressed either persist for another 4–8 weeks before a regime shift, or snap violently when a binary catalyst arrives. The two spikes above +3.0 (June 2025 and November 2025) both preceded meaningful equity drawdowns within 10 trading days.
What these two charts together tell you is something the headline VIX number obscures: the current calm is regime-level low, in a context where every previous visit to similar levels was followed by a rapid, high-amplitude regime shift. The June 2025 spike to a regime score above 3.5 preceded a 7% SPX drawdown. The November 2025 spike to 3.2 came alongside an oil shock and a Fed communication misstep. The March 2026 spike to just under 3.0 was triggered by the Iran conflict escalation. Each time, the recovery was faster than the previous one. The market has been conditioned to buy the vol spike. That conditioning is the risk.