
The Calendar’s Seasonality Quiet Edge
A data-driven journey through the patterns that have persisted for over a century — and what it actually takes to exploit them without blowing up in the process.

“Sell in May and go away” first appeared in the Financial Times in 1964. As someone who’s spent years watching markets, backtesting strategies, and riding the emotional swings of my own portfolio, I believed markets were too efficient and too global for something as simple as the calendar to matter. Then I looked closer at the data.

Part I — The Pattern That Refuses to Die
A Voice That Surfaces Every Spring
The underlying seasonal lull from May through October had been noticed by traders for decades, even centuries. Its roots trace back to 18th-century London, where wealthy investors would literally leave the city for country estates after the social season, leaving markets thin and quiet. The saying eventually earned an academic name: the Halloween indicator - because the smart money supposedly returns around late October.
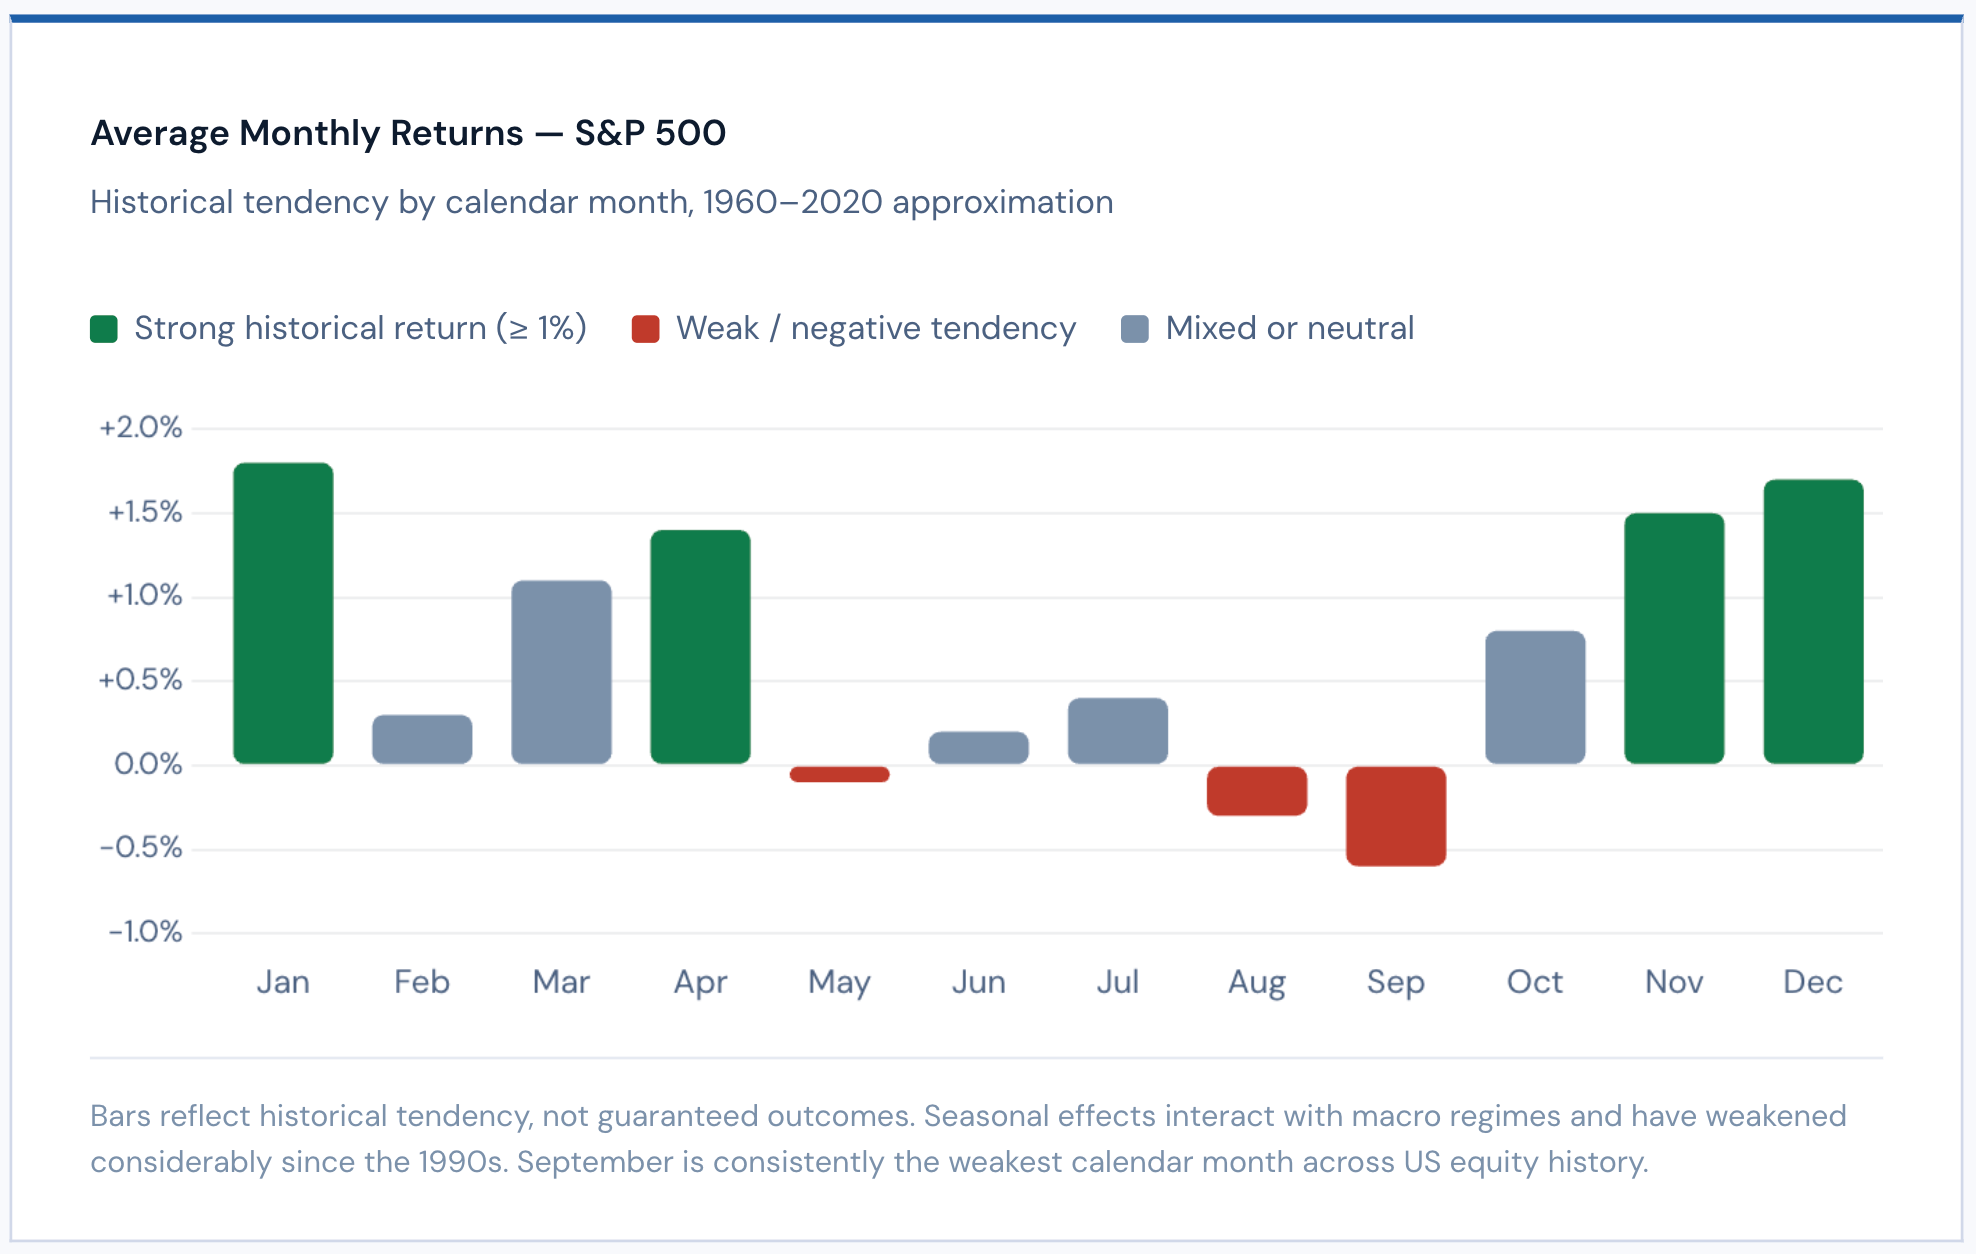
What makes this pattern fascinating is how stubbornly it has held up. Across nearly every major stock market in the world, equities have historically delivered close to zero (or even negative) real returns from May through October, while generating the bulk of their long-term gains from November through April. This seasonal asymmetry has been documented across decades, indices, and geographies, from the U.S. and Europe to emerging markets.
It’s one of those rare market rhythms that refuses to die, even in our hyper-connected, algorithm-driven world. And it raises a simple but provocative question: if everyone knows about it, why hasn’t it disappeared?