
Using Sentiment Data to Forecast S&P 500 Returns
How Behavioral Signals Become Tradable in Quantitative Practice

Markets don’t move because people read the news — they move because people react to it.
If you’ve watched markets swing from euphoria to panic at lightning speed over the past few years, you’re not alone. The relentless stream of headlines — COVID waves, geopolitical flare-ups, banking stresses — has pushed investors to look beyond traditional macro indicators. Most of those tools are backward-looking and increasingly disconnected from real-time behavior. Which raises the real billion-dollar question:
Can daily news sentiment be quantified and systematically used to predict market returns — in a way that holds up out-of-sample?
Most sentiment indicators fail that test. They’re intellectually interesting, but commercially useless, because the underlying signal isn’t distilled with enough rigor. Turning a chaotic media landscape into tradable insight requires structure, scale, and objectivity.

The San Francisco Fed’s Daily News Sentiment Index (DNSI) has quietly earned a spot on serious quant desks. Instead of relying on surveys or social media chatter, it sifts through institutional news with a massive NLP pipeline, turning words into objective, time-stamped measures of economic sentiment.
The Data
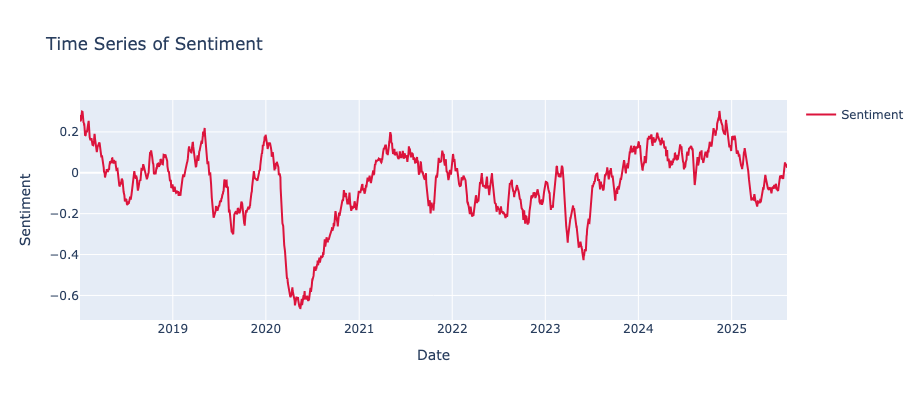
The Daily News Sentiment Index (DNSI) is a high-frequency gauge of economic sentiment derived from large-scale textual analysis of news articles. Developed by Shapiro, Sudhof, and Wilson, the index leverages content from 24 major U.S. newspapers collected via Factiva, and applies a structured lexical model to extract positive and negative sentiment related specifically to the economy.
Rather than treating sentiment as a one-off snapshot, the DNSI uses a geometrically-weighted rolling window, giving more weight to recent articles and progressively less weight to older ones. The result is a smooth yet responsive time series that captures the evolving tone of daily economic news flow.
The Quantitative Hypothesis
The question isn’t whether sentiment affects markets — we already know it does.
The real question is whether daily sentiment contains information about tomorrow’s return — and if so, under what exact conditions.
To answer that, we start with linear regression — a deceptively simple but highly effective tool in settings where the signal-to-noise ratio is low and interpretability matters. It gives us:
A clearly interpretable relationship between sentiment and returns
A robust baseline model that works with moderate feature sets
Fast training and easy validation for rapid iteration
Let’s formalize the hypothesis:
Null (H₀): Daily sentiment has no predictive power for next-day S&P 500 returns once standard autocorrelation and volatility effects are accounted for.Alternative (H₁): Extreme values in the Daily News Sentiment Index are systematically associated with non-zero excess returns in the S&P 500 over the following trading day.In model form:
Where:
Rₜ₊₁ - S&P 500 return tomorrow
β - This coefficient quantifies how much Rₜ₊₁ is expected to change for a one-unit change in Sentimentₜ
Volₜ - realized volatility
εₜ - error term
The key question: Is beta β significantly different from zero — and is the effect usable in an actual trading framework?
To test that, I used DNSI data from 2015–2025 and aligned it with next-day S&P 500 returns.
The sentiment series was first standardized:
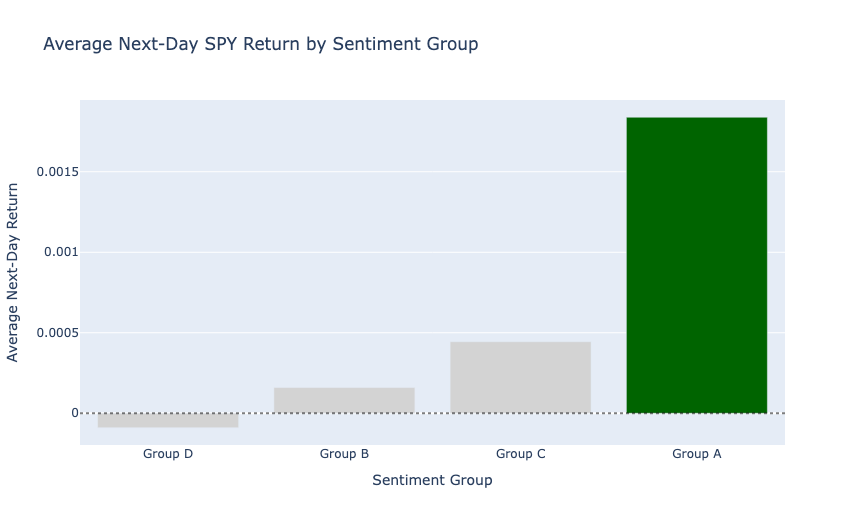
Then each day was sorted into quartiles — from most pessimistic to most optimistic — to examine how forward returns behave across sentiment regimes.
This immediately revealed three important behaviors:
1. Nonlinear response — neutral sentiment produces essentially flat forward returns.
2. Asymmetry — only one tail of the sentiment distribution produces a meaningful deviation in next-day return. The other tail is statistically indistinguishable from noise.
3. Threshold dependency — the effect only appears when sentiment crosses a specific threshold and only in the presence of a short-term behavioral reaction. Standard drift-based models completely miss it.
To put it bluntly: the direction of the effect is not what most people intuitively expect — and the magnitude is far larger than what you usually see in daily index data.
There is a signal here. But it’s hidden, asymmetric, and only actionable when you isolate the correct slice of the distribution.
In fact, a simple model built on this effect produces a 65% win rate, a 1.6 profit factor, and over 400% exposure-adjusted return — while being in the market less than 6% of the time.
In the next section, we’ll build that model step-by-step and walk through the backtest results, key takeaways, and practical implementation details.