

For the first time in history, the S&P 500 breached the 7,500 mark. The index’s market capitalization swelled by $10.9 trillion in just seven weeks — a pace of wealth creation with no modern precedent. The rally was not built on euphoria alone, anchored by AI-driven earnings beats, a geopolitical pivot in Beijing, and a structural technology spending cycle that shows no sign of slowing.
The proximate catalyst for the latest leg higher came directly from Beijing. President Trump’s summit with Xi Jinping on May 14 — the first visit by a sitting U.S. president to China in nearly a decade — delivered a market-positive set of outcomes: a joint commitment to keep the Strait of Hormuz open and free of tolls, Xi’s indication that China would not provide military aid to Iran, and Xi’s expressed interest in buying more U.S. oil to reduce Chinese dependence on the strait entirely. For a market that had spent months pricing in energy-shock risk from the U.S.-Israel war against Iran, this was a meaningful de-escalation.
Both sides agreed that the Strait of Hormuz must remain open and free of tolls. Xi additionally signaled interest in buying more U.S. oil to reduce China’s dependence on the strait going forward — and the two leaders committed to increasing Chinese purchases of U.S. agricultural products. Business leaders from America’s largest companies accompanied Trump’s delegation. Markets read this correctly: the bilateral relationship has a floor.
But this article is not about this week. It is about what comes next. The confluence of signals across equities, volatility, commodities, and technology spending points to a second half that will reward informed positioning and punish passive drift. Let's map it.
— MACRO CONTEXT
The AI Capex Supercycle Is Not a Theme — It’s Infrastructure
Technology now accounts for 55% of all U.S. capital expenditure — the highest share ever recorded, surpassing even the peak of the dot-com era. But unlike 2000, today’s spending is backed by revenues, operating cash flows, and a demand pipeline that is measurably real.
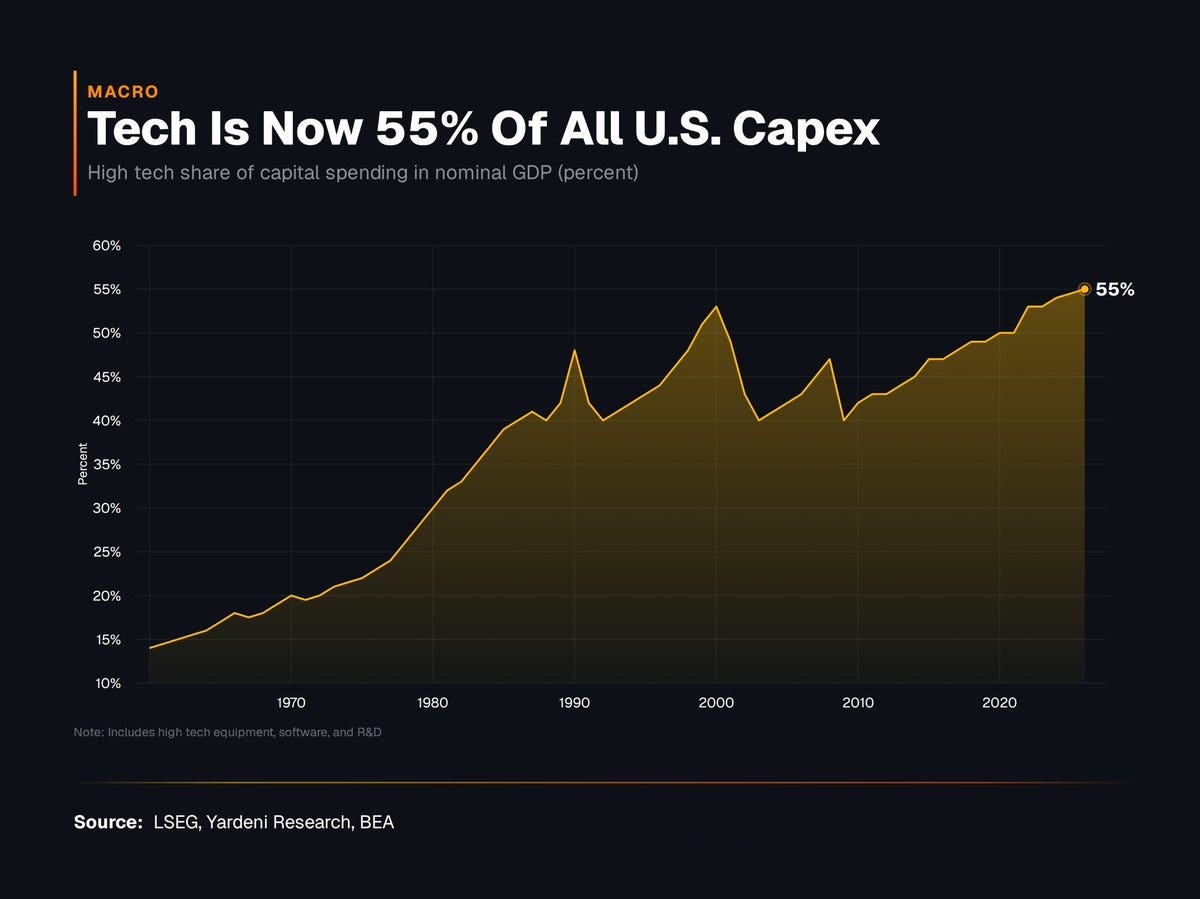
The chart above is one of the most important macro images of 2026. It took six decades for tech’s capex share to climb from 15% to 50%. It has now accelerated past that ceiling — and the driver is unmistakably AI infrastructure: data centers, GPUs, networking, and the energy to power them.
Bridgewater Associates estimates that Alphabet, Amazon, Meta, and Microsoft could collectively invest around $650 billion in AI-related infrastructure in 2026 alone. These are not aspirational budgets — they are already being deployed. Microsoft reported $31.9 billion in capital expenditures in its fiscal Q3; Alphabet’s Q1 2026 showed $35.7 billion in property and equipment purchases; Meta raised its 2026 capex outlook to $125–$145 billion.
This spending is beginning to have macro-level consequences. Rising semiconductor prices are now contributing to global inflation — a phenomenon being called “chipflation” — as AI demand grows faster than the industry’s ability to produce. The AI infrastructure spend has not slowed, and hyperscaler capex guidance keeps stepping higher, with multi-year supply commitments stretching into 2027. This is not a spending pause — it is a structural commitment.
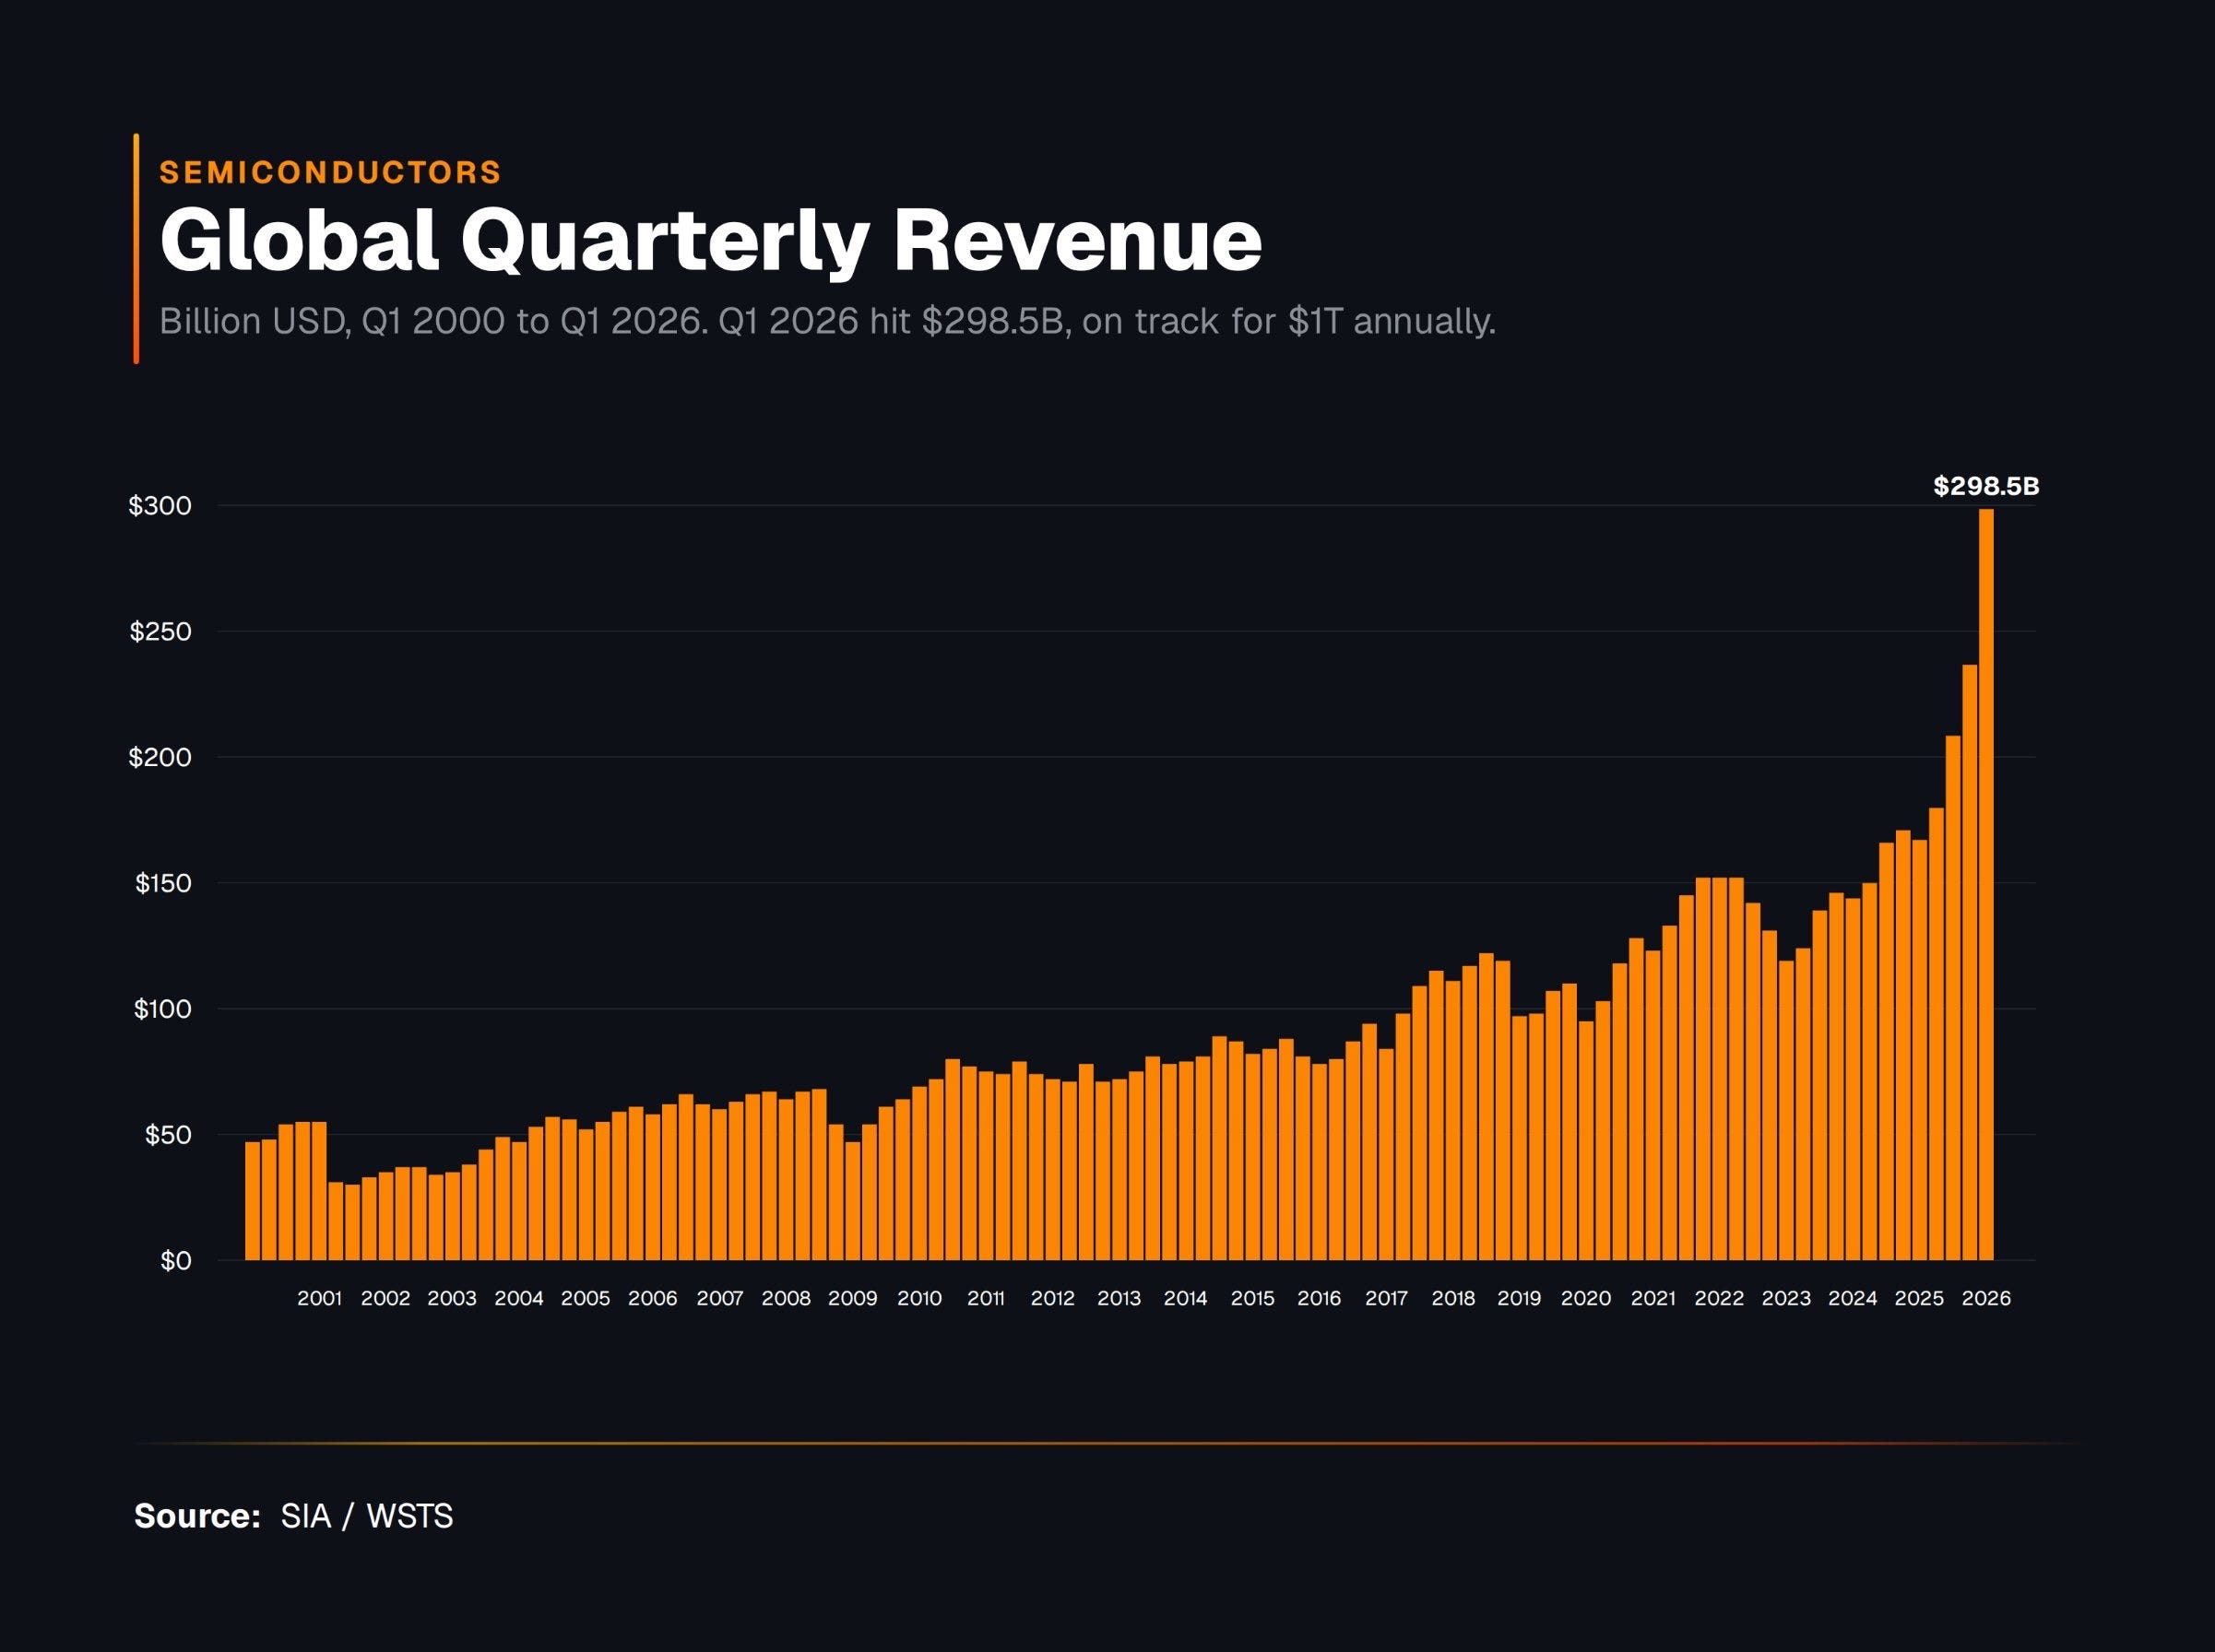
Global semiconductor revenue hit $298.5B in Q1 2026, placing the industry squarely on track for a $1 trillion annual run-rate. The curve is not just steep — it is nearly vertical at the right end. The dot-com era peak looks like a speed bump by comparison.
The AI Hardware Rotation: Who Benefits Next?
Nvidia anchored the first phase of this cycle. Investors have now rotated their attention downstream, toward the memory and storage sectors that feed the GPU buildout. Micron Technology (+156% YTD) and SK Hynix (+190% YTD) are the poster children of that rotation. But the next layer of value creation may be hiding in plain sight.