Real yields set the swings; central banks set the floor. Confusing the two is expensive.
For two decades gold behaved like a mirror held up to real interest rates: yields up, gold down, with metronomic reliability. Around 2024 the mirror cracked. Gold returned some 65% in 2025, its best year since 1979, in the same twelve months that ten-year American real yields averaged close to 2%, their highest since 2007. The textbooks say these two things cannot happen together; rising real rates are supposed to be gold’s natural predator. Anyone still pricing the metal off the TIPS curve has been reading the wrong instrument.
The correction sharpens the question rather than settling it. Gold touched roughly $5,405 an ounce on the LBMA benchmark in January 2026, then gave back a hefty slice of the gain, trading near $4,170 by early July. Now that the momentum crowd has left the building, the awkward question is being asked out loud: what, exactly, is holding the price up?
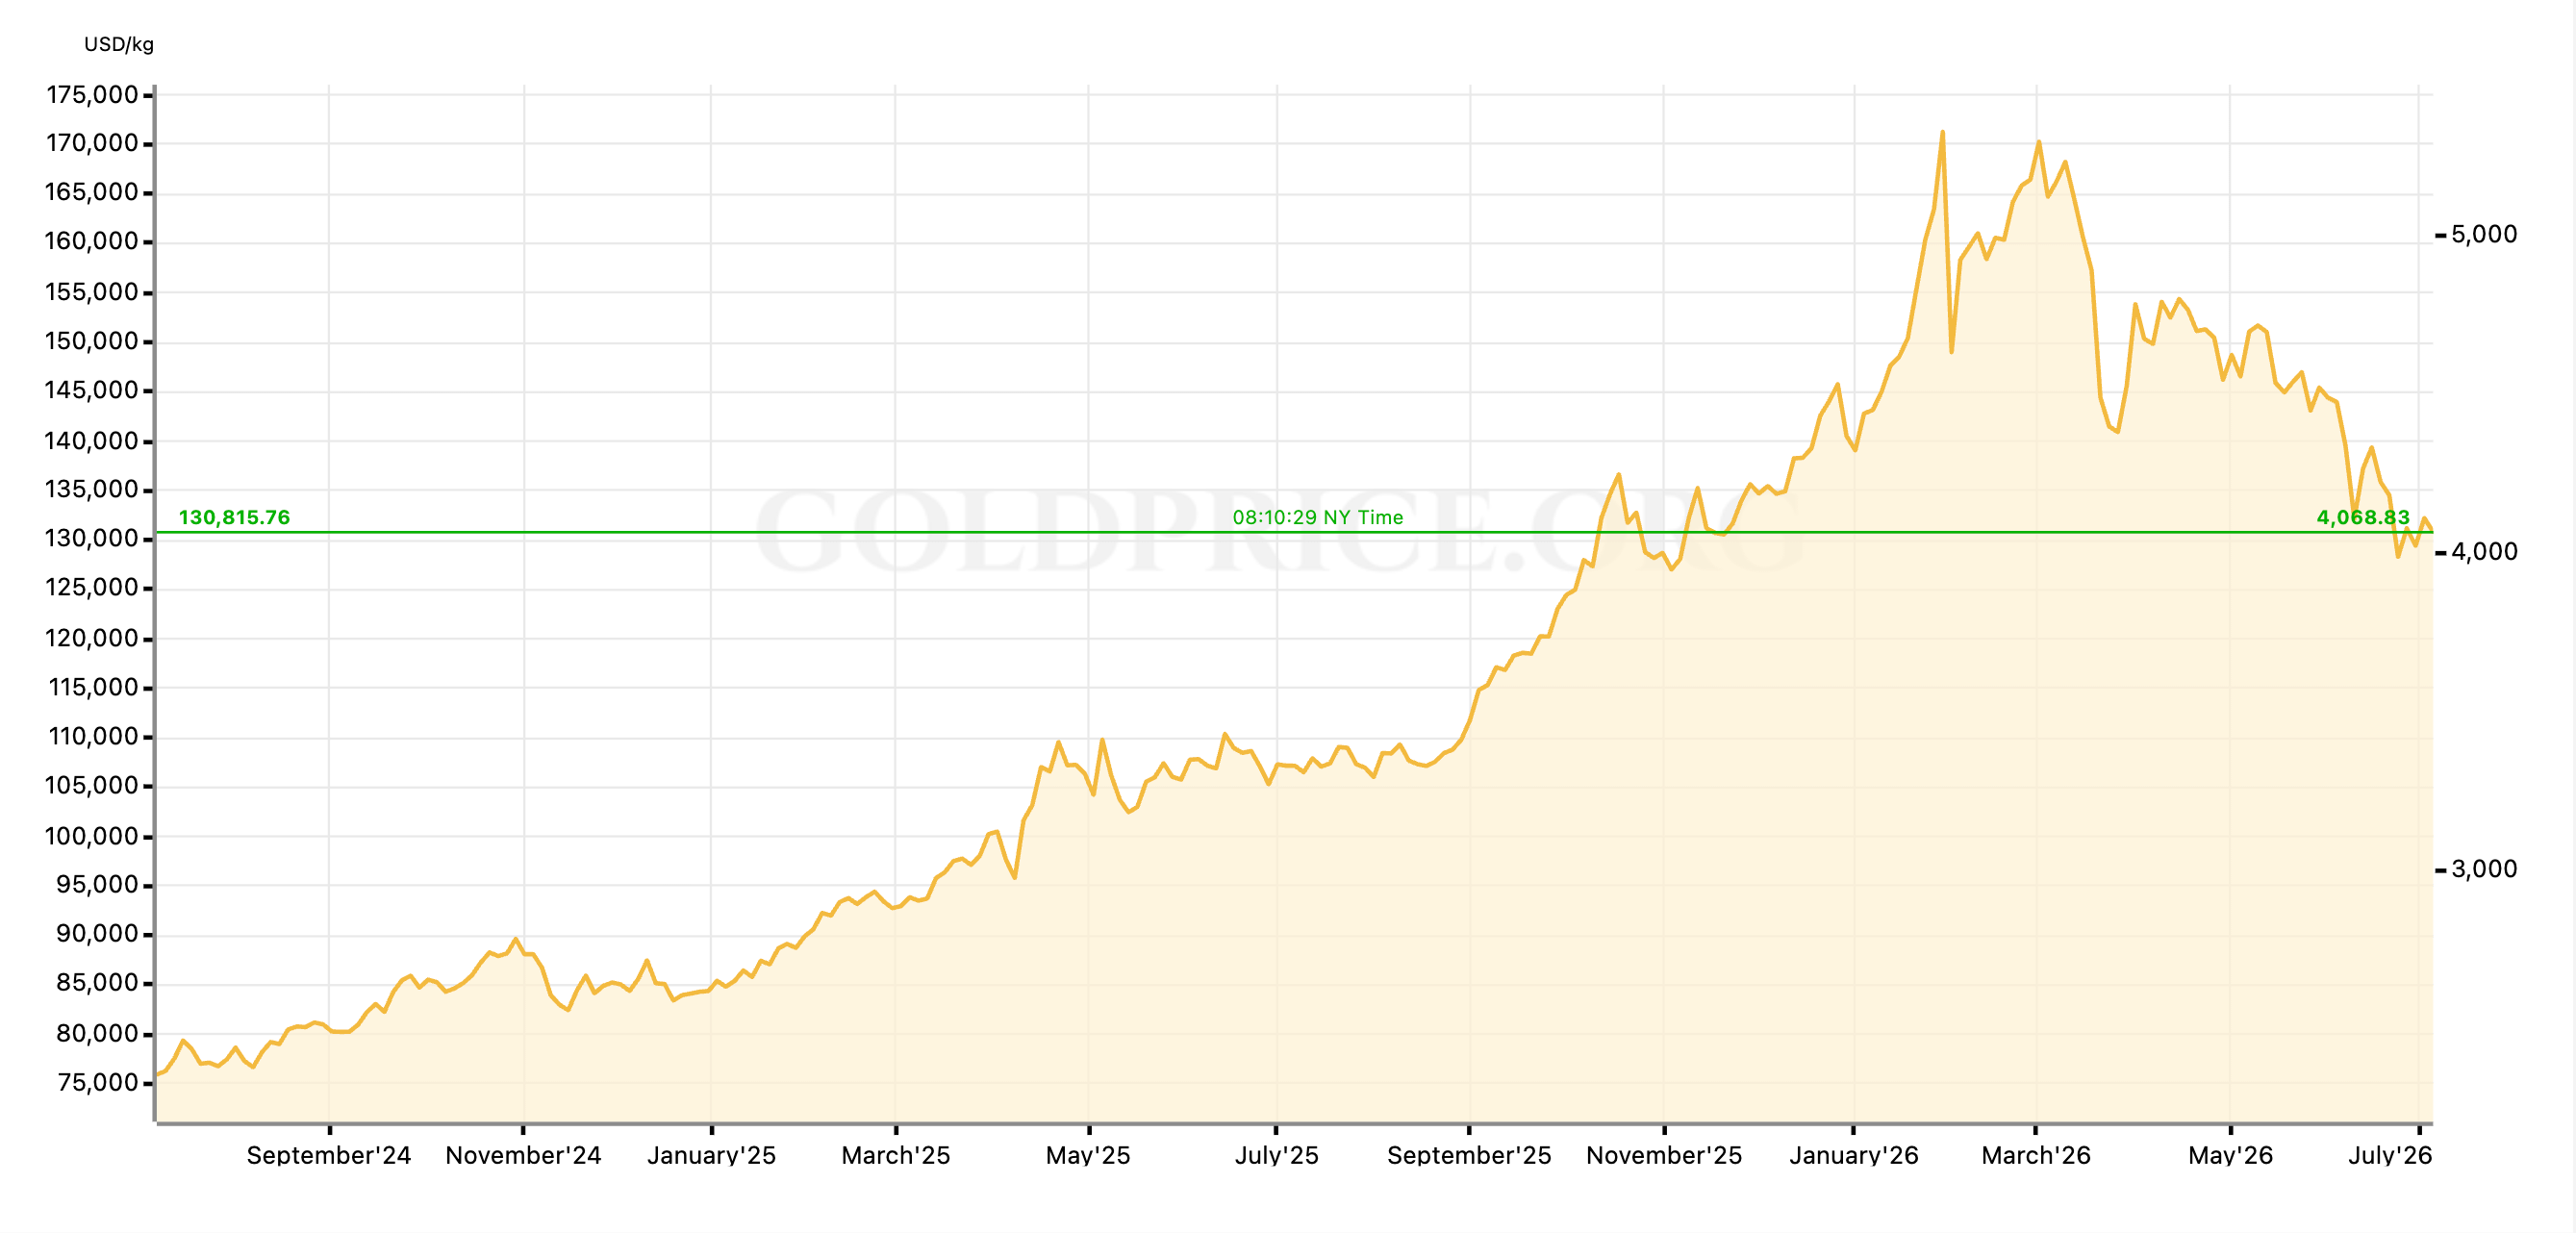
Most trading desks still price gold off real rates, its old cyclical driver, and keep missing the level—because the buyer who now sets the price at the margin does not appear in that model at all. That gap is the argument of this piece. Sitting on the wrong side of it has been an expensive way to be theoretically correct.
There is a tidy way to take the metal apart: separate the part that sets the floor from the part that sets the amplitude. Do that, and 2025’s melt-up and 2026’s stumble stop looking like a contradiction. They run on different clocks—and most of the industry is still checking its watch against the fast one.
In fairness to the crowd
The real-rate model earned its reputation the honest way: it worked. From 2004 to 2021, gold traded like a very long-duration inflation-linked bond that had simply forgotten to pay a coupon. Regressed against the ten-year American real yield over that window, it carried an empirical duration of roughly 18 years: a 100-basis-point rise in real yields knocked about 18% off the inflation-adjusted price. The long-run correlation sat near minus 0.8. For the better part of a generation, knowing the TIPS yield was as good as knowing gold’s direction.
Then the relationship broke, and not politely. Through 2025, real yields sat at an eighteen-year high while gold rose by two-thirds. The model did not merely miss its forecast, it pointed the wrong way. What replaced it is a reserve-allocation story: a slow, structural, and dull grind—right up until the moment it shifts.
The buyer changed, the model confirmed
Prices are set at the margin, by whoever trades next, not by whoever holds most. From 2010 to 2021 the marginal buyer was Western ETF money, and ETF money is a pure real-rate machine. It holds a yieldless metal only when doing so is cheap: it buys as real yields fall and sells as they rise. That is why the TIPS relationship looked so clean for so long. The model was never describing gold. It was describing the buyer.
From 2022 the marginal buyer became the official sector, and central banks do not keep an opportunity-cost spreadsheet. They buy gold for reserve diversification and sanctions insurance, not for carry. The trigger is specific and dateable. Freezing Russia’s central-bank reserves in 2022 proved that dollar assets parked offshore can simply be switched off, and every reserve manager not aligned with Washington took note. Gold, alone among reserve assets, carries no counterparty and no issuer: nobody’s promise, nobody’s balance-sheet. Basel III then made the point official, reclassifying gold as a Tier 1 asset alongside cash and government bonds.
The scale settles any doubt. Between 2021 and 2025 central banks bought around 225 tonnes a quarter, roughly double the pace of the previous five years. Each of 2022, 2023 and 2024 cleared 1,000 tonnes; 2025 added another 863, the fourth-largest annual total on record. Monthly estimates put official buying near 60 tonnes, against a pre-2022 average closer to 17. Central banks’ share of total gold demand has climbed from about a tenth in the 2010s to roughly a fifth today. A buyer that big, that steady and that indifferent to price does not move the price around. It moves the floor underneath it.
Two clocks, one price
Gold’s price is best read as the sum of two things—a structural floor and a cyclical amplitude—running on two different clocks.
The structural floor is set by the price-inelastic buyer, the official sector, plus a slow debasement updraft off sovereign balance-sheets. It moves in years and could not care less what the TIPS yield did this week. The cyclical amplitude is set by the price-sensitive buyer: Western capital reacting to real rates, ETF flows and the dollar. It moves in weeks, and it moves loudly. The real-rate model reads the amplitude with precision. It is simply blind to the floor beneath it.
The interesting part is what happens when the clocks interact, because the arithmetic turns non-linear fast. Most of the time they simply add: the floor rises quietly while the amplitude swings the price around it.
When they align—real yields falling while the reserve bid runs hot—the effect multiplies , and you get January’s near-vertical run to $5,400. When they diverge—real yields rising against a floor that refuses to budge—you do not get a crash. You get a cushioned correction, because the inelastic buyer quietly absorbs what the elastic buyer sells. That asymmetry is the tell: gold rises hard when real yields fall and gives back comparatively little when they rise. The old relationship has gone convex.
The floor shows up in the reserve data
The best evidence for the floor sits in the reserve data. On the ECB’s own analysis, gold has overtaken the euro to become the world’s second-largest reserve asset—a first since Bretton Woods ended. By end-2024 gold made up close to 20% of global official reserves, against roughly 16% for the euro and about 47% for the dollar. Rewind to 2018 and gold was 11.6% of reserves while the dollar commanded 54.6%. The reallocation moves in a straight line with a clear direction: gold is taking the share the dollar is giving up.
That is the whole case for durability, in one fact. A new Fed chair, or one hawkish surprise on rates, can crush the amplitude overnight. It cannot reverse a decision taken independently by more than thirty emerging-market central banks, all rebalancing away from the dollar since 2022 for reasons that have not gone away. The floor moves slowly because it is being poured by institutions that have never once looked at the TIPS chart.
The cross-asset effect of Gold
This is where the framework earns its keep: the same force turns up in 4 markets at once.
The Bond Market (Rates)
Global debt exploded to a staggering $340 trillion by mid-2025, and governments own a record 30% of it. Investors are getting terrified of holding long-term government debt because countries are drowning in deficits. As a result, they are demanding higher premiums to hold bonds, while quietly bidding up gold.
The Currency Market (Foreign Exchange)
Gold and the U.S. dollar are on a seesaw—when the dollar’s grip slips, gold wins. Central banks aren’t dumping the Euro but they dump Dollar, and gold is catching the fallout. Even better for gold bugs: math models show the U.S. dollar index is still 9% overvalued. As the dollar gradually adjusts toward its fair value, it is poised to give dollar-priced gold a natural, long-term boost.
The Stock Market (Equities)
American stock-bond correlations climbed to thirty-year highs through the post-Covid inflation shock, so the bond leg of a standard 60/40 portfolio has stopped hedging the equity leg. When your insurance policy stops paying out, you shop for another, and a metal with no counterparty is the obvious quote. Some of the institutional flow into gold is simply the fallout from bonds failing to diversify. With a record $7.5 trillion parked in money-market funds, there is no shortage of dry powder for that rotation, and it is released as cash yields fall.
The Metals Market (Commodities)
In commodities, the breadth confirms the story but is easy to misread. Silver and platinum joining the rally says this is a monetary repricing, not a gold-specific quirk. But silver is the high-beta amplitude play and gold is the floor; treat them as interchangeable and a leveraged book gets hurt the moment the cyclical clock turns. The metals rhyme. They do not share a floor.
What does AI do to gold?
The obvious objection is AI. If it delivers the productivity boom its boosters promise, the equilibrium real rate rises and so does the cost of holding a yieldless metal. History has run this experiment: the 1990s boom, with its high real rates, strong dollar and heavy official selling, ground gold down to roughly $252 by mid-1999. On the naive chain—AI equals technology equals risk-on—gold is the one asset the future forgot to invite.
Sort the channels onto the two clocks, though, and the picture changes. Every bearish vector sits on the amplitude side: a higher natural rate, disinflation as AI compresses the cost of cognition, capital crowding into the earnings story. Powerful, cyclical—and already in the real-rate model.
The bullish vectors sit on the floor, and they are heavier. The AI buildout—data centres, grid, power—is one of the largest capex waves in history, and it is inflationary while it is being built. Gold mining is energy-hungry, so AI’s appetite for power lifts gold’s own cost of production. AI rivalry hardens the US–China split and speeds up the very reserve diversification this piece is built on. And if AI displaces labour at scale, the tax base shrinks while claims on the state grow. A sovereign at 100–120% debt-to-GDP cannot absorb that with orthodox policy; the path of least resistance is financial repression—negative real yields, on purpose.
That last vector inverts the 1990s comparison, which assumes a government balance-sheet that no longer exists. AI may raise the natural real rate while fiscal arithmetic caps the realised one—and gold trades on the realised rate. The question is whether long real yields track r* or get pinned below it. Whether AI succeeds is almost beside the point.
Add it up and gold is a strangle on AI outcomes: short the middle, long both wings.
The bearish case needs one scenario—the goldilocks middle, in which AI delivers steadily, fiscal pressure eases and geopolitics behaves. The bullish case owns both tails: AI disappoints (the concentration unwinds, cuts are forced through, real rates collapse) or succeeds too well (labour displacement, debasement, escalation). And unlike a strangle bought in the market, this one is paid to wait.
Sequencing matters too. The real-rate headwind is cyclical and arrives early; the debasement and trust tailwinds are structural and compound. One channel has no 1990s precedent: AI degrades the reliability of information itself. In a world of synthetic media and machine-written narratives, the premium rises on the one asset with nothing to verify. Bitcoin competes for that premium but drags its own AI-adjacent tail risk behind it—quantum computing threatens its cryptography. A lump of metal is unbothered.
The position
The upshot: price gold as floor plus amplitude, rather than a single real-rate trade. My odds, not advice: roughly 70–75% that the floor holds above $4,000 over the next twelve months, whatever real rates do. The amplitude—sideways in $4,300–$4,700 or a re-test of $5,400—is close to a coin-toss on the Fed. Conviction on the floor; none on the amplitude. On AI, I weight the debasement branch above the 1990s replay, which makes the strangle modestly constructive, with positive skew.
The downside belongs on the record; a position without one is just a forecast in disguise. If the floor gives way, official demand was more price-sensitive than the thesis assumed, the correction runs toward $3,600–$3,800, and the two-clock model needs rebuilding. That is the bill I would owe.
What confirms the thesis and what kills it, with levels:
Confirms: the floor holds in the $4,000–$4,300 band through this drawdown, even when price action looks soft.
Confirms: OTC and Swiss-refinery estimates of official demand stay above roughly 200 tonnes a quarter, and Chinese net imports stay elevated.
Confirms: the next reserve-composition print shows gold taking another step of share from the dollar.
Confirms (AI regime): realised long real yields lag rising r* estimates—repression by another name.
Confirms (AI regime): electricity PPI runs hot, and term premium rises during equity drawdowns rather than falling.
Invalidates: a weekly close below $4,000 that holds. The floor was thinner than the reserve data implied.
Invalidates: two consecutive quarters of net official-sector selling on the OTC-adjusted estimate. The marginal buyer stepping back is the one thing the thesis cannot survive.
Invalidates (AI regime): realised long real yields tracking r* upward for several quarters with no fiscal strain in term premium—the goldilocks middle asserting itself.
The cleanest tell is estimated official flow—specifically the gap between the reported number and the estimated one. In the first quarter of 2026, reported central-bank buying looked to be cooling, with one large seller dumping 60 tonnes. The OTC and refinery-derived estimate showed buying rising, to around 244 tonnes from 208. The reported line arrives late, incomplete and sometimes pointing the wrong way. Watch the estimate.
Step back and the regime is the real subject. The risk-free asset is being re-rated in slow motion; stocks and bonds fall together often enough to impair the 60/40 hedge; the dollar’s privilege erodes at the margin. In that world gold is still the hedge against the monetary base itself, a structural role the old crisis-alarm-bell framing misses entirely.
For twenty years gold answered to the real-yield chart. It still reads it, it has simply stopped taking orders from it, because the buyer who now sets the price never took orders from it either. Gold is not a bet on AI. It is the hedge against every world in which AI and the fiscal state cannot both be right.
— Alina Khay
This is a research note and a record of my own market thinking, not investment advice or a personal recommendation. Nothing here considers your objectives, financial situation, or risk tolerance. Markets can move against this view; use your own judgment and seek professional advice where appropriate.


