
Quantitative Momentum Strategy
Simplicity or complexity? The real tradeoff in trading system design.
Two camps dominate systematic trading. One favors simplicity — clean rules, fast execution, easy testing. The other leans into complexity — high-dimensional models, machine learning, statistical nuance.
After testing both extremes — strategies built on a single moving average, others trained on thousands of variables — here’s what the evidence actually shows:
Simplicity isn’t naive. Complexity isn’t automatically better. Real edge often lives in the space between.
Well-handled complexity can surface genuine, tradable signals. But for most independent traders, operational simplicity matters as much as statistical power. What you need is edge — distilled, explainable, and executable.

My framework for evaluating any strategy:
Before I greenlight a new system, I ask five questions — not a rigid checklist, but a structured lens:
Is the edge explainable and durable? If it’s rooted in behavioral or structural factors, it’s more likely to persist.
Are the biases ruled out? I stress-test for look-ahead bias, survivorship bias, and faulty cost assumptions.
Does data support the theory? Out-of-sample consistency matters — not in-sample noise.
Is execution realistic? Great ideas die if you can’t trade them cleanly or cost-effectively.
Can I run it sustainably? If it consumes hours I don’t have, it’s a no — regardless of performance.
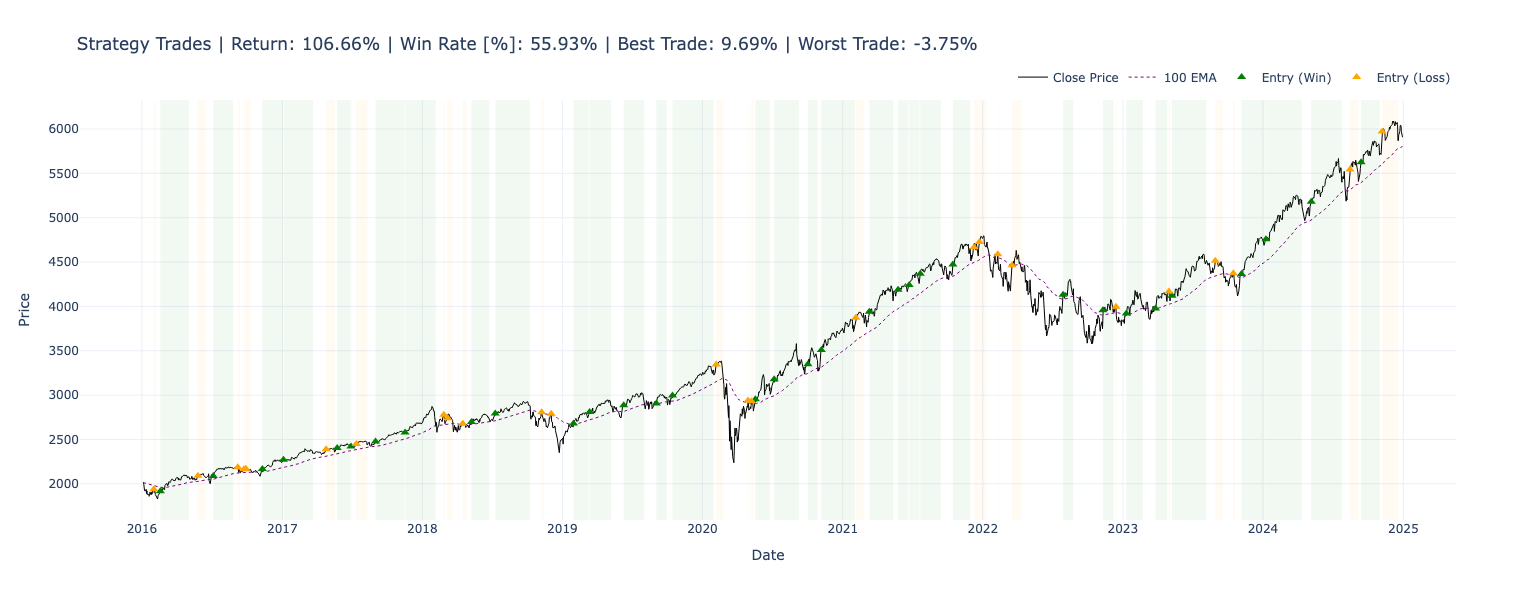
Free Strategy: Momentum EMA Cross with Trend Filter
This strategy respects the market’s natural rhythm. It waits for long-term trend and short-term momentum to align — then enters with a defined edge.
Why it works:
Momentum alone underperforms when it runs against the broader trend. This system filters for trend first — using the 100-period EMA as a baseline — and only enters when short-term momentum confirms. You’re not guessing reversals. You’re entering after the market has already revealed its direction.
From a quantitative standpoint, this setup captures directional persistence without overfitting. It limits false positives in choppy conditions and exits cleanly when momentum fades.
Rules:
Trend filter — Only trade long if close > 100-period EMA
Entry — Go long when 6 EMA crosses above 12 EMA
Exit — 6 EMA crosses back below 12 EMA, or price falls 3% below entry
Execution — Runs one bar at a time; enters at close on valid signal; exits on next close
Backtest Results — S&P 500 (2016–2024)
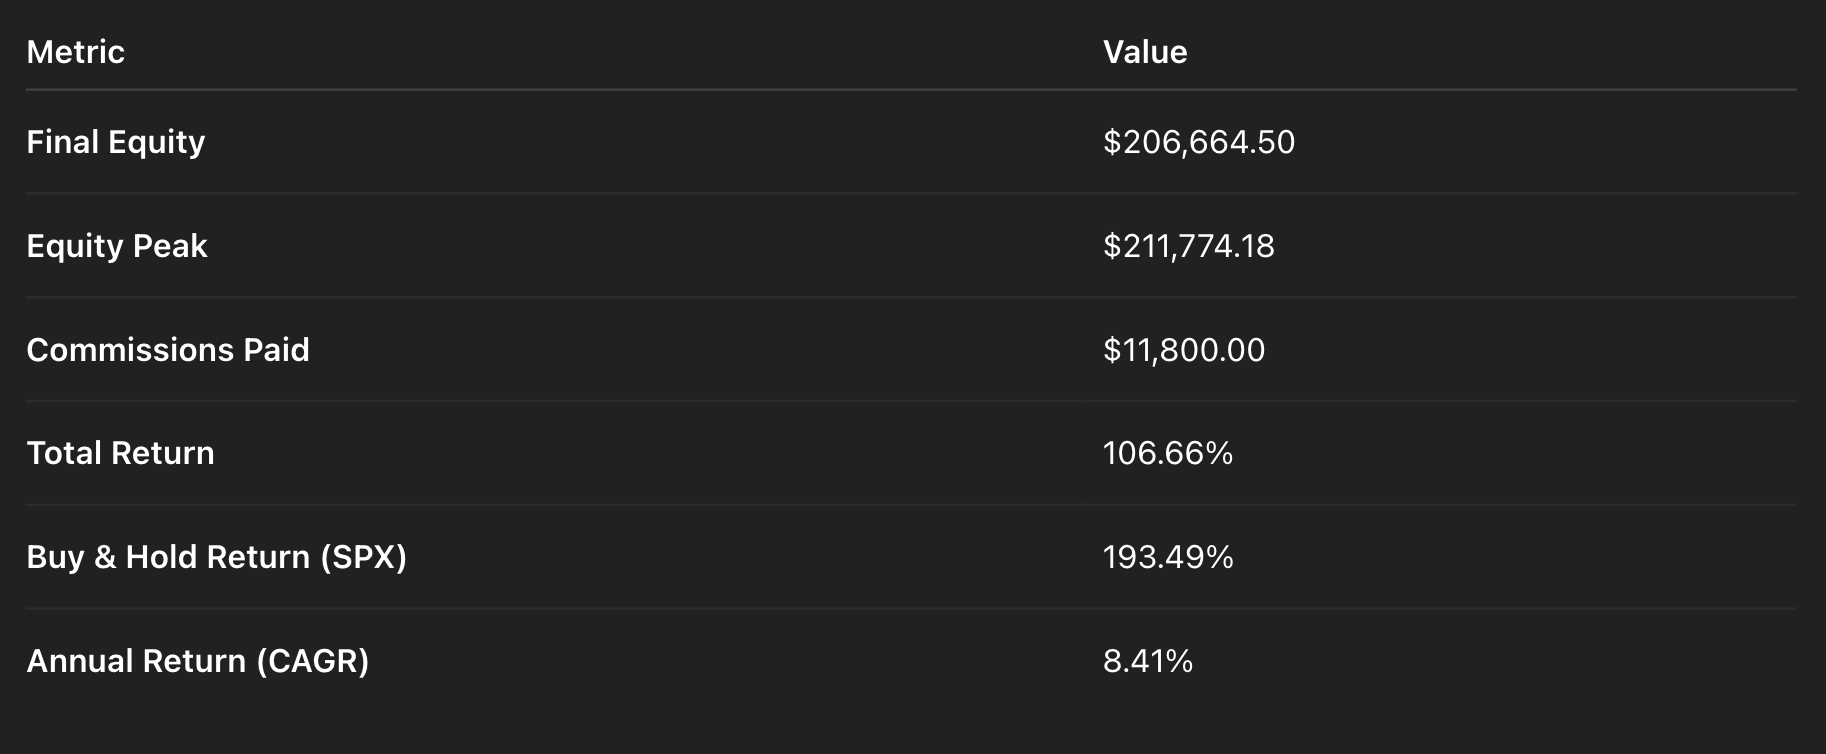
Performance
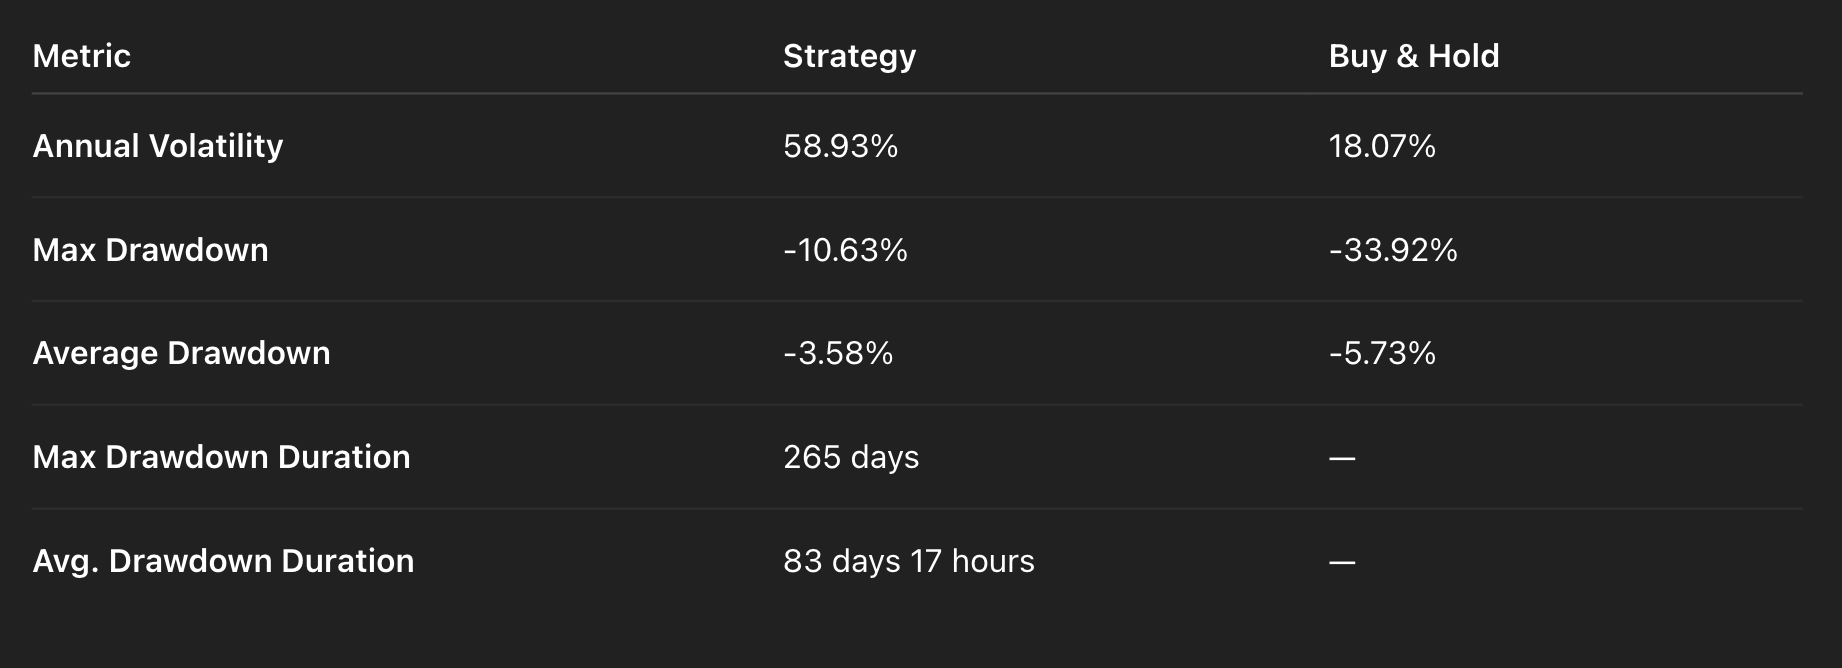
Risk & Volatility
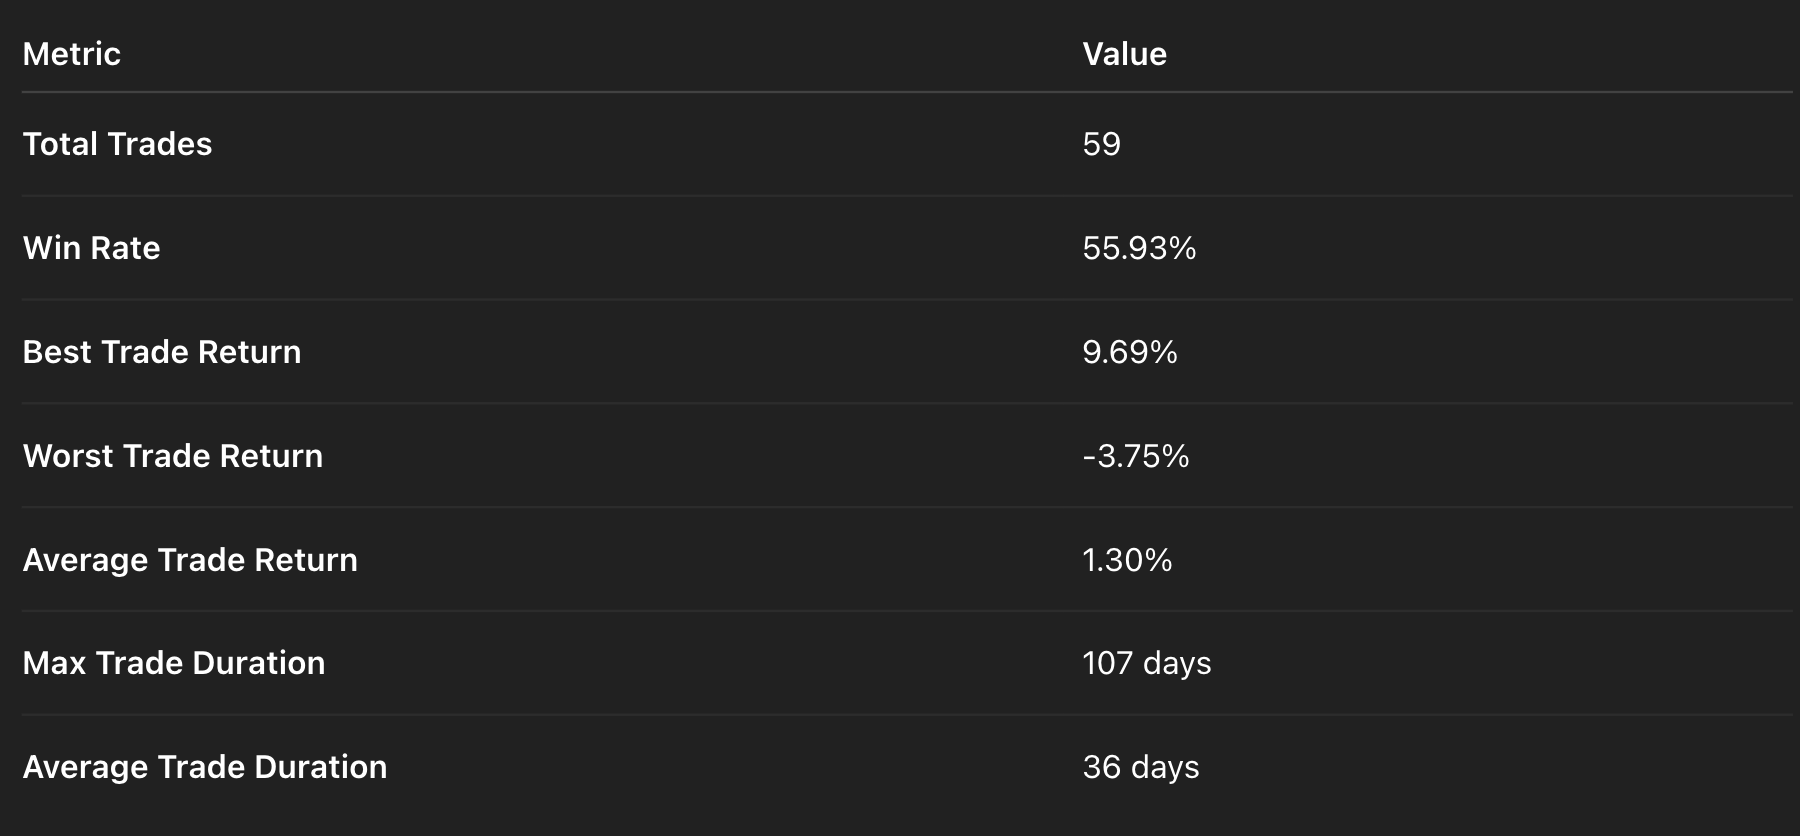
Trade Statistics
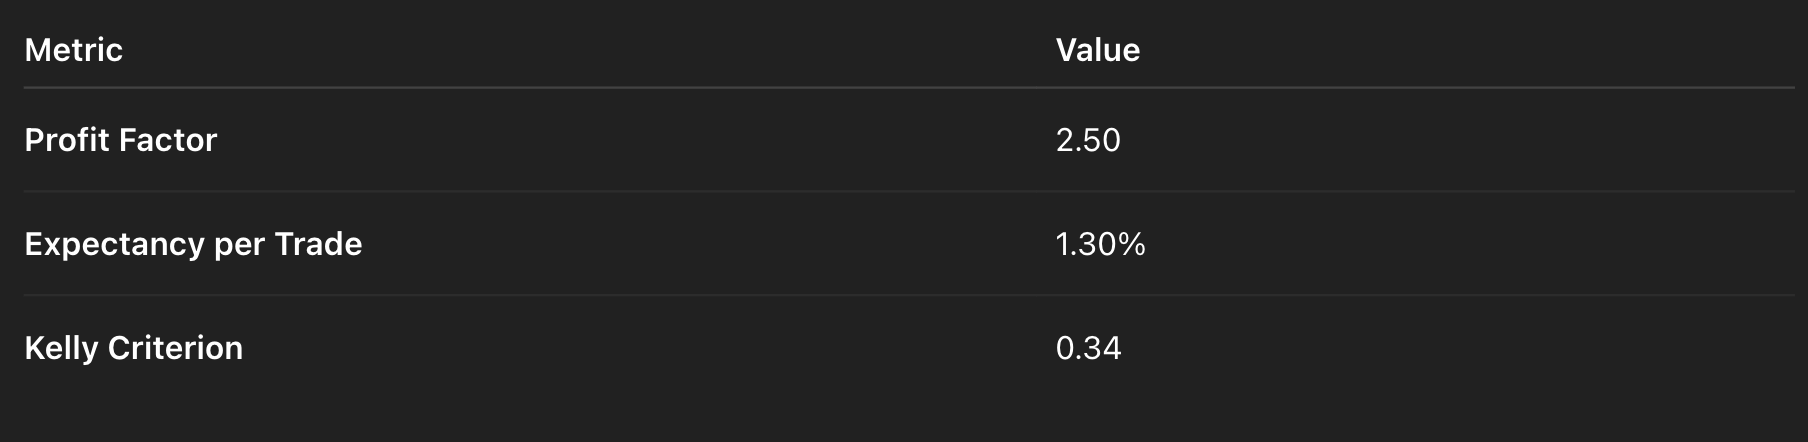
Strategy Metrics
Key strengths:
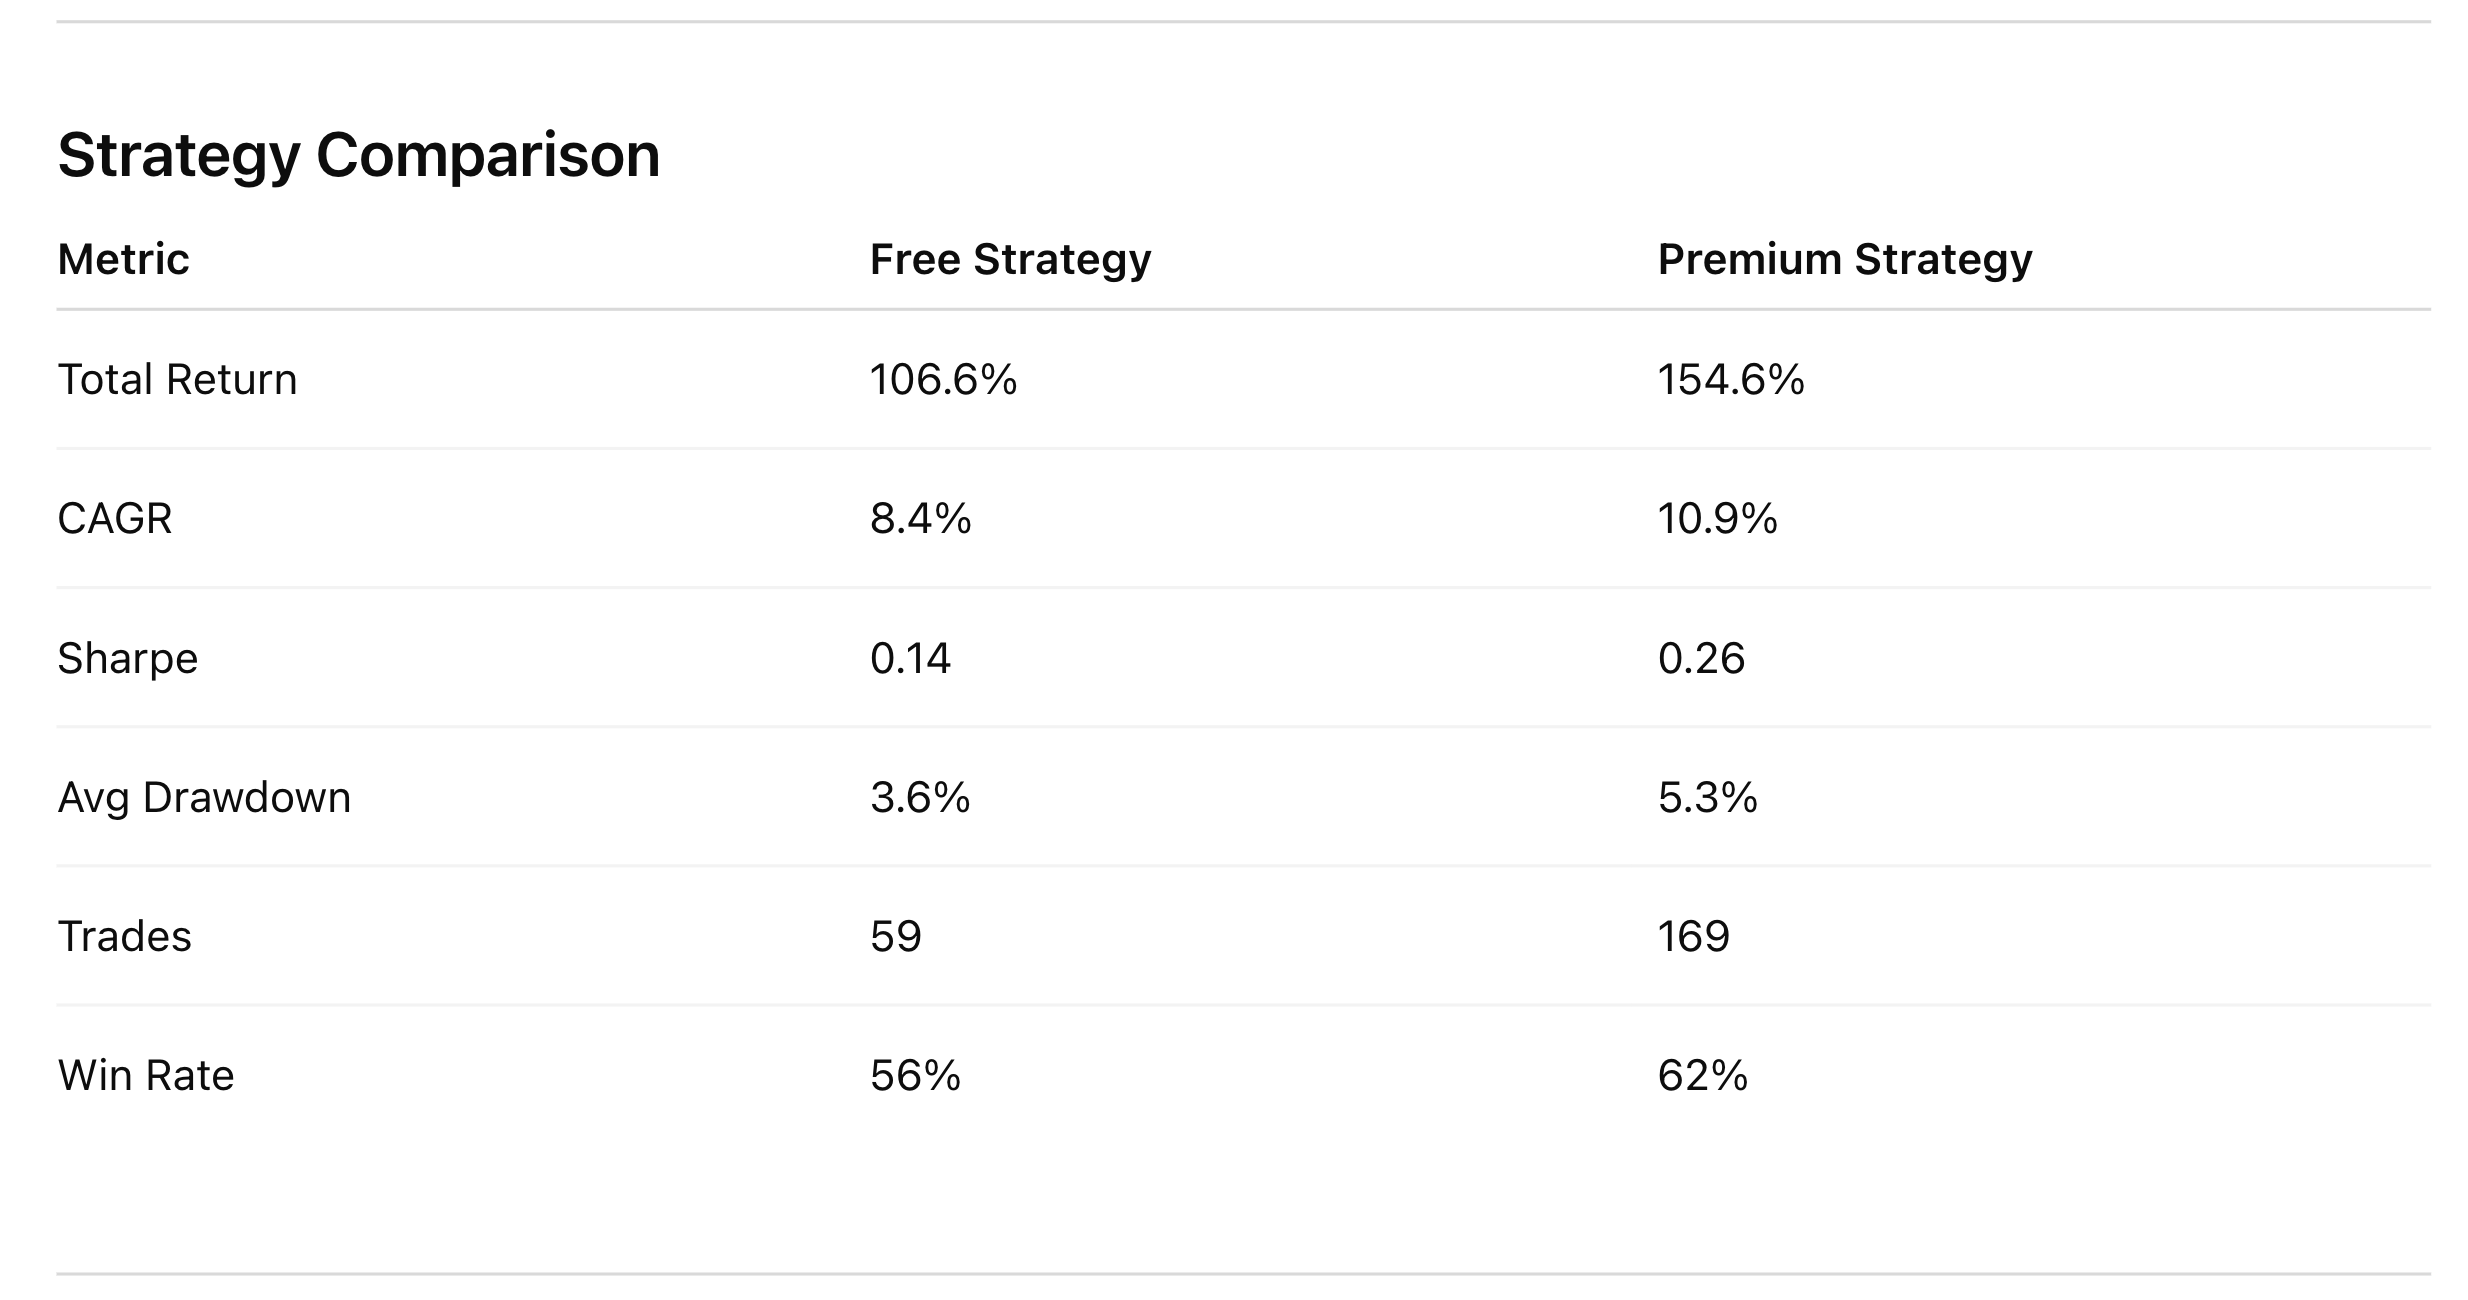
Risk-adjusted edge — Raw return is lower than buy-and-hold, but max drawdown is three times smaller (11% vs. 34%). You compound steadily with significantly less capital risk.
Selective execution — 59 trades over nine years. No overtrading. A 56% win rate with controlled position sizing.
Profit factor > 2.5 — For every dollar risked, the strategy returns $2.50. That reflects disciplined entries and exits, not luck.
65% market exposure — You’re out of the market a third of the time, reducing risk during uncertainty and preserving capital.
Low behavioral strain — The worst trade lost 3.7%, against the S&P’s 33.9% max drawdown over the same period.
Suited to swing traders and systematic investors who want a repeatable, low-maintenance edge. Works on stocks, indices, and ETFs — anywhere trend persistence matters more than speed.
The Premium Strategy goes Further.
The free version above is real, tested, and tradable. The premium strategy is what I actually run — it adapts faster, performs across more asset classes, and trades with higher precision.
Premium PDF includes:
Full strategy logic
Entry and exit systems
Risk and position sizing rules
Backtest breakdown
Mathematical rationale
Trade examples
Pre-trade checklist
It runs on stocks, futures, and crypto.